PROTECTED SOURCE SCRIPT
Fusion A+B Enhanced
Fusion A+B Enhanced (English overview – no code revealed)
What it is
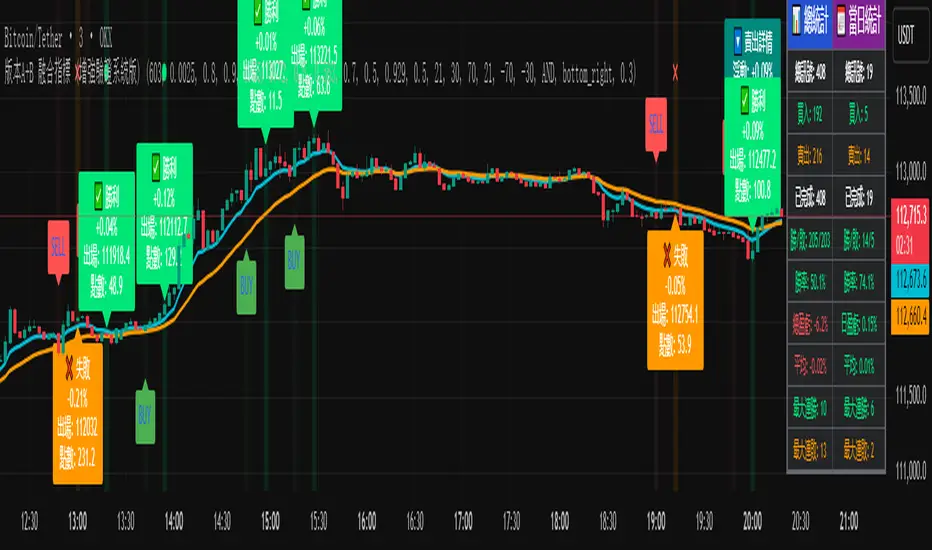
A lightweight overlay that waits for several micro-structure clues to line up, then paints a single “BUY” or “SELL” arrow on the 10-minute chart. After the arrow appears the script starts a built-in timer; when the timer expires it marks the result with a green dot (win) or red cross (loss) and updates a live score-board.
What you see on the chart
Two smooth lines that track the short- and intermediate-term direction.
One arrow per side – no repainting, no stack of signals.
A small label that follows price and shows entry price, live P&L and the seconds left on the clock.
Optional background flashes the moment a signal is generated or the timer expires.
A two-column table (total vs. today) that tracks hit-rate, average return, longest winning/losing streak and current draw-down.
Core ideas under the hood (no formulas)
Trend filter – the arrow only fires if the short-term and intermediate-term directions agree.
Pattern filter – a weighted mix of classic reversal shapes (V-bottom / top), support/respect touches and engulfing bars.
Exhaustion filter – an RSI or Williams %-R gate is applied with either “AND” or “OR” logic so signals are ignored if the market is already over-stretched.
Scoreboard – each ingredient adds a user-defined weight; the sum must reach a minimum “conviction” number before an arrow is printed.
Timer exit – every trade is closed after a fixed number of seconds; wins and losses are recorded immediately and used to refresh the statistics.
What it is
A lightweight overlay that waits for several micro-structure clues to line up, then paints a single “BUY” or “SELL” arrow on the 10-minute chart. After the arrow appears the script starts a built-in timer; when the timer expires it marks the result with a green dot (win) or red cross (loss) and updates a live score-board.
What you see on the chart
Two smooth lines that track the short- and intermediate-term direction.
One arrow per side – no repainting, no stack of signals.
A small label that follows price and shows entry price, live P&L and the seconds left on the clock.
Optional background flashes the moment a signal is generated or the timer expires.
A two-column table (total vs. today) that tracks hit-rate, average return, longest winning/losing streak and current draw-down.
Core ideas under the hood (no formulas)
Trend filter – the arrow only fires if the short-term and intermediate-term directions agree.
Pattern filter – a weighted mix of classic reversal shapes (V-bottom / top), support/respect touches and engulfing bars.
Exhaustion filter – an RSI or Williams %-R gate is applied with either “AND” or “OR” logic so signals are ignored if the market is already over-stretched.
Scoreboard – each ingredient adds a user-defined weight; the sum must reach a minimum “conviction” number before an arrow is printed.
Timer exit – every trade is closed after a fixed number of seconds; wins and losses are recorded immediately and used to refresh the statistics.
สคริปต์ที่ได้รับการป้องกัน
สคริปต์นี้ถูกเผยแพร่เป็นแบบ closed-source อย่างไรก็ตาม คุณสามารถใช้ได้อย่างอิสระและไม่มีข้อจำกัดใดๆ – เรียนรู้เพิ่มเติมได้ที่นี่
คำจำกัดสิทธิ์ความรับผิดชอบ
ข้อมูลและบทความไม่ได้มีวัตถุประสงค์เพื่อก่อให้เกิดกิจกรรมทางการเงิน, การลงทุน, การซื้อขาย, ข้อเสนอแนะ หรือคำแนะนำประเภทอื่น ๆ ที่ให้หรือรับรองโดย TradingView อ่านเพิ่มเติมที่ ข้อกำหนดการใช้งาน