PROTECTED SOURCE SCRIPT
ที่อัปเดต: On-Chain Z-Score Suite
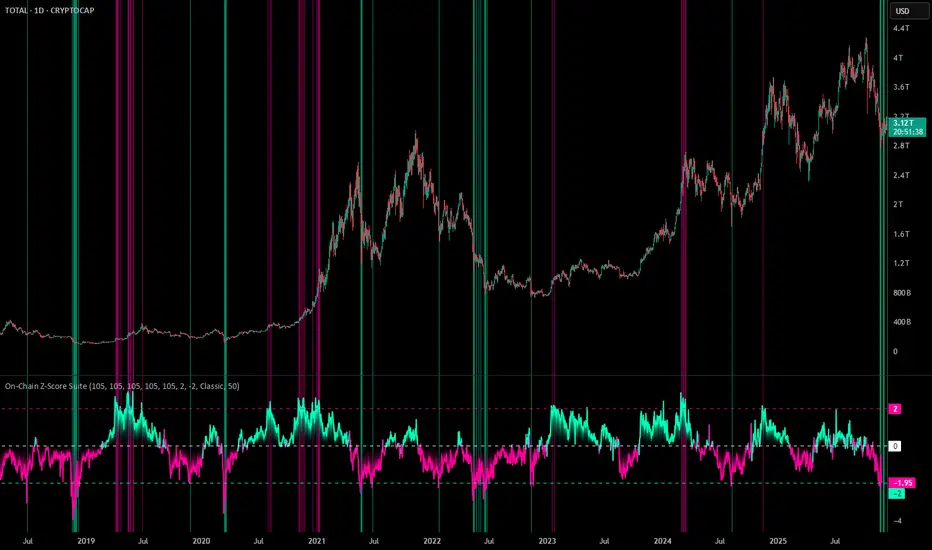
On-Chain Z-Score Suite
The On-Chain Z-Score Suite is a composite valuation indicator that aggregates some of the most robust Bitcoin on-chain pricing models—MVRV, SOPR, Net Unrealized Profit/Loss (NUPL), the Puell Multiple, and the Pi Cycle Top Indicator—by converting each into its respective historical z-score and then calculating a customizable equal-weighted or user-adjusted average. This unified z-score reflects how far current market conditions deviate, in standard-deviation terms, from long-term norms across multiple independent fundamental frameworks simultaneously. Users can enable or disable individual components, adjust their relative weights, and define custom overbought and oversold thresholds, allowing the indicator to be fine-tuned to different market cycles and personal risk preferences. Historically, extreme positive readings of the composite z-score have coincided with major cycle tops, while deeply negative readings have marked capitulation bottoms, offering a statistically grounded, multi-factor perspective on Bitcoin valuation and market sentiment.
MVRV
The Market Value to Realized Value (MVRV) is an advanced on-chain indicator designed to assess the ratio between the Market Value and the Realized Value of Bitcoin.
Market Value is calculated as the current price of Bitcoin multiplied by its circulating supply and realized Value is derived by multiplying the realized price of Bitcoin (the price at which the coins last moved) by the circulating supply. It represents the total cost basis of all Bitcoin held.
SOPR
The Spent Output Profit Ratio (SOPR) is an advanced on-chain indicator that measures the ratio between the combined USD value of all Bitcoin outputs spent on a given day and their combined USD value at the time of creation. SOPR offers a window into aggregate seller behavior, effectively representing the USD amount received by sellers divided by the USD amount they originally paid.
NUPL
The Net Unrealized Profit and Loss (NUPL) is an advanced on-chain indicator that is measured by subtracting the Realized Value from Market Value. Realized Value takes the price of each Bitcoin when it was last moved. It adds up all individual prices and takes an average. It multiplies that average price by the total number of coins in circulation. Market Value is the current price of Bitcoin multiplied by the number of coins in circulation. This gives us the NUPL which estimates the total paper profits/losses in Bitcoin held by investors.
Puell Multiple
The Puell Multiple is calculated by dividing the total USD value of Bitcoin issued today (newly mined coins × BTC price) by the 365-day moving average of that daily issuance value. It shows how today's miner revenue compares to the past year's average.
Pi Cycle
The Pi Cycle Top Indicator uses the 111 day moving average (111DMA) and a newly created multiple of the 350 day moving average, the 350DMA x 2 (the multiple is of the price values of the 350DMA, not the number of days). For the past three market cycles, when the 111DMA moves up and crosses the 350DMA x 2 we see that it coincides with the price of Bitcoin peaking. It is also interesting to note that 350 / 111 is 3.153, which is very close to Pi = 3.142, thus the name.
Features
The script compares the Z-score with customizable threshold levels to generate overbought and oversold levels. A Z-score exceeding the upper threshold suggests potential overbought conditions, while a Z-score below the lower threshold may indicate oversold conditions.
This script offers several customizable inputs, enabling traders to tailor the indicator to their preferences. The length determines the lookback period that the Z-score is calculated over. Traders can also adjust the thresholds to define the sensitivity of overbought and oversold conditions.
It has 10 available color schemes to choose from and the background coloring on the chart can be toggled on and off.
Practical Applications
This indicator is designed for traders who focus on identifying cycle extremes and potential mean reversion opportunities. By using Z-score analysis, this tool can be particularly effective for detecting points of overextension in the market, where a reversion to the mean is likely.
Detecting Overbought and Oversold Conditions: The Z-score measures how far the price has deviated from its norm, allowing traders to identify overbought or oversold conditions with precision.
Timing Market Reversals: The indicator provides early signals of potential market reversals by highlighting when the price has moved too far away from its average, helping traders anticipate reversion opportunities.
เอกสารเผยแพร่
Update:- Added the option to adjust the background color transparency under the "Visual" section.
สคริปต์ที่ได้รับการป้องกัน
สคริปต์นี้ถูกเผยแพร่เป็นแบบ closed-source อย่างไรก็ตาม คุณสามารถใช้ได้อย่างอิสระและไม่มีข้อจำกัดใดๆ – เรียนรู้เพิ่มเติมได้ที่นี่
คำจำกัดสิทธิ์ความรับผิดชอบ
ข้อมูลและบทความไม่ได้มีวัตถุประสงค์เพื่อก่อให้เกิดกิจกรรมทางการเงิน, การลงทุน, การซื้อขาย, ข้อเสนอแนะ หรือคำแนะนำประเภทอื่น ๆ ที่ให้หรือรับรองโดย TradingView อ่านเพิ่มเติมใน ข้อกำหนดการใช้งาน