OPEN-SOURCE SCRIPT
Coloured Volume Grid 1.0
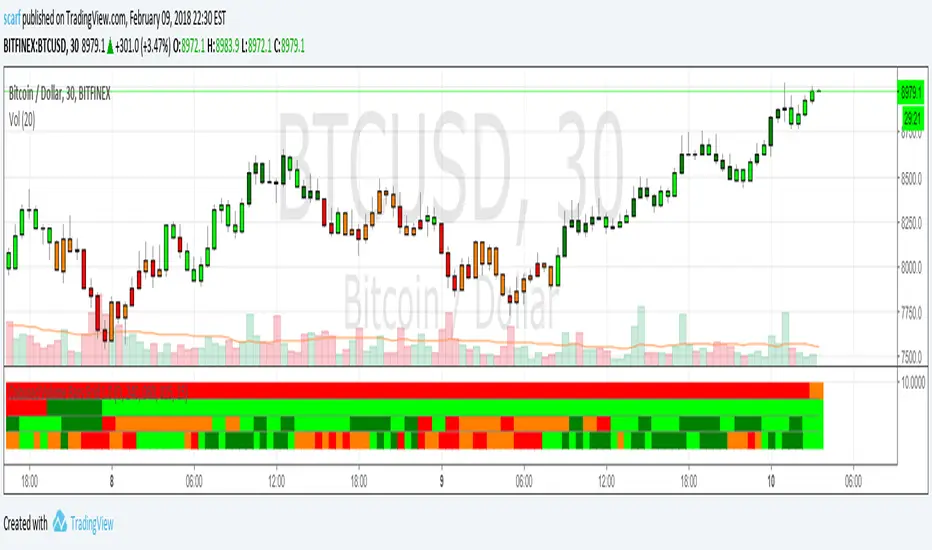
Candles are coloured based on relative price and volume:
- If today’s closing price and volume are greater than (n) bars ago, color today’s volume bar green.
- If today’s closing price is greater than (n) bars ago but volume is not, color today’s volume bar lime.
- Similarly, if today’s closing price and volume is less than (n) bars ago, color today’s volume bar orange.
- If today’s closing price is less than (n) bars ago but volume is not, color today’s volume bar red.
The above logic in itself gives pretty remarkable considering how simple the idea is. I have added a multi-timeframe feature where the same logic is applied to 4 other timeframes. This way you can quickly be aware without having to check. There are four layers and the default settings show (from top to bottom) daily, 4h, 1h and 15m
All timeframes are adjustable in the settings.
สคริปต์โอเพนซอร์ซ
ด้วยเจตนารมณ์หลักของ TradingView ผู้สร้างสคริปต์นี้ได้ทำให้เป็นโอเพนซอร์ส เพื่อให้เทรดเดอร์สามารถตรวจสอบและยืนยันฟังก์ชันการทำงานของมันได้ ขอชื่นชมผู้เขียน! แม้ว่าคุณจะใช้งานได้ฟรี แต่โปรดจำไว้ว่าการเผยแพร่โค้ดซ้ำจะต้องเป็นไปตาม กฎระเบียบการใช้งาน ของเรา
คำจำกัดสิทธิ์ความรับผิดชอบ
ข้อมูลและบทความไม่ได้มีวัตถุประสงค์เพื่อก่อให้เกิดกิจกรรมทางการเงิน, การลงทุน, การซื้อขาย, ข้อเสนอแนะ หรือคำแนะนำประเภทอื่น ๆ ที่ให้หรือรับรองโดย TradingView อ่านเพิ่มเติมใน ข้อกำหนดการใช้งาน