OPEN-SOURCE SCRIPT
FIB vs HL
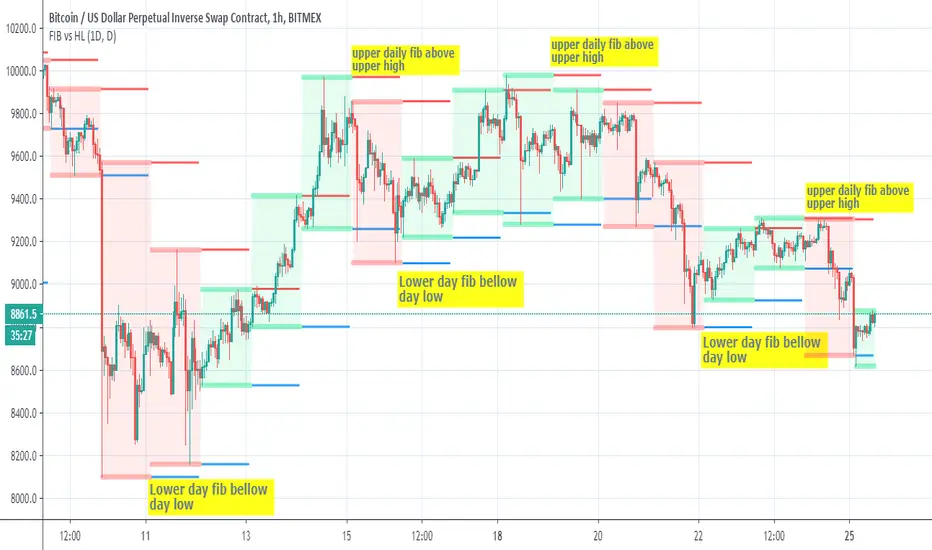
This script show the relation bettwen daily fib seen in red =upper and blue=lower to daily candles upper and lower
since there is slight variation how both calculated we can see that when daily fib is lower then the low candles daily low then there is a good chance for a buy trend
and vice versa in oposite direction
so it just a nice idea that need further verification
since there is slight variation how both calculated we can see that when daily fib is lower then the low candles daily low then there is a good chance for a buy trend
and vice versa in oposite direction
so it just a nice idea that need further verification
สคริปต์โอเพนซอร์ซ
ด้วยเจตนารมณ์หลักของ TradingView ผู้สร้างสคริปต์นี้ได้ทำให้เป็นโอเพนซอร์ส เพื่อให้เทรดเดอร์สามารถตรวจสอบและยืนยันฟังก์ชันการทำงานของมันได้ ขอชื่นชมผู้เขียน! แม้ว่าคุณจะใช้งานได้ฟรี แต่โปรดจำไว้ว่าการเผยแพร่โค้ดซ้ำจะต้องเป็นไปตาม กฎระเบียบการใช้งาน ของเรา
คำจำกัดสิทธิ์ความรับผิดชอบ
ข้อมูลและบทความไม่ได้มีวัตถุประสงค์เพื่อก่อให้เกิดกิจกรรมทางการเงิน, การลงทุน, การซื้อขาย, ข้อเสนอแนะ หรือคำแนะนำประเภทอื่น ๆ ที่ให้หรือรับรองโดย TradingView อ่านเพิ่มเติมใน ข้อกำหนดการใช้งาน