OPEN-SOURCE SCRIPT
ICT Liquidty H/L [MK]
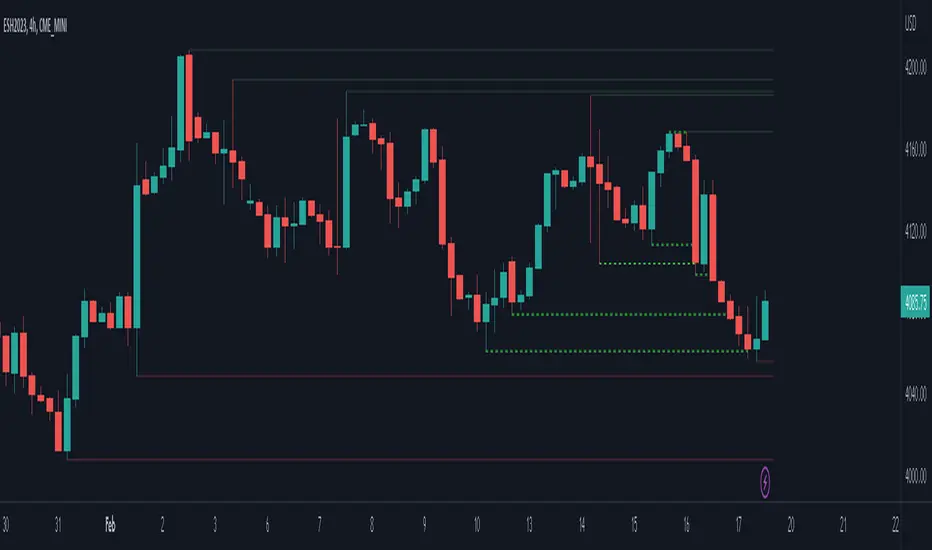
indicator shows liquidity levels at pivot highs and lows on the chart timeframe. Levels are drawn as a horizontal line up to the last active bar. Once a level has been passed through, the level is highlighted. The liquidity level will remain highlighted until a pre determined amount of bars have closed after the level was passed. These liquidity levels can be used as targets for trades, or as potential reversal points. Liquidity (or resting orders) at key pivot points form a key part of the ICT trading system. Users can configure the indicator to display the untapped liquidity levels, or they can be completely hidden until they are passed through.

สคริปต์โอเพนซอร์ซ
ด้วยเจตนารมณ์หลักของ TradingView ผู้สร้างสคริปต์นี้ได้ทำให้เป็นโอเพนซอร์ส เพื่อให้เทรดเดอร์สามารถตรวจสอบและยืนยันฟังก์ชันการทำงานของมันได้ ขอชื่นชมผู้เขียน! แม้ว่าคุณจะใช้งานได้ฟรี แต่โปรดจำไว้ว่าการเผยแพร่โค้ดซ้ำจะต้องเป็นไปตาม กฎระเบียบการใช้งาน ของเรา
คำจำกัดสิทธิ์ความรับผิดชอบ
ข้อมูลและบทความไม่ได้มีวัตถุประสงค์เพื่อก่อให้เกิดกิจกรรมทางการเงิน, การลงทุน, การซื้อขาย, ข้อเสนอแนะ หรือคำแนะนำประเภทอื่น ๆ ที่ให้หรือรับรองโดย TradingView อ่านเพิ่มเติมใน ข้อกำหนดการใช้งาน