OPEN-SOURCE SCRIPT
52-Week & 5-Year High/Low with Dates
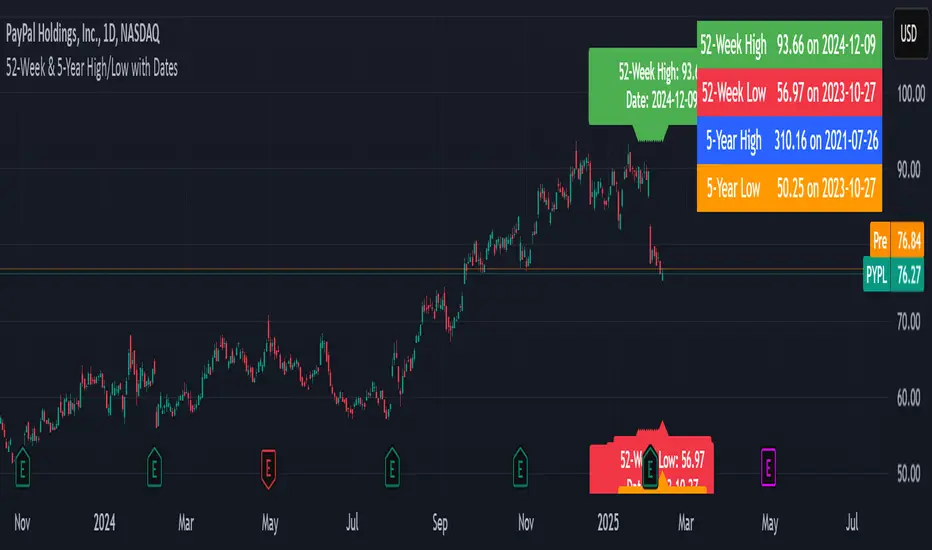
This indicator is designed to help traders quickly identify key price levels and their historical context by displaying the 52-week high/low and 5-year high/low prices along with their respective dates. It provides a clear visual representation of these levels directly on the chart and in a dashboard table for easy reference.
Key Features
52-Week High/Low:
Displays the highest and lowest prices over the last 252 trading days (approximately 52 weeks).
Includes the exact date when these levels were reached.
5-Year High/Low:
Displays the highest and lowest prices over the last 1260 trading days (approximately 5 years).
Includes the exact date when these levels were reached.
Visual Labels:
High and low levels are marked on the chart with labels that include the price and date.
Dashboard Table:
A table in the top-right corner of the chart summarizes the 52-week and 5-year high/low prices and their dates for quick reference.
Customizable Date Format:
Dates are displayed in the YYYY-MM-DD format for clarity and consistency.
สคริปต์โอเพนซอร์ซ
ด้วยเจตนารมณ์หลักของ TradingView ผู้สร้างสคริปต์นี้ได้ทำให้เป็นโอเพนซอร์ส เพื่อให้เทรดเดอร์สามารถตรวจสอบและยืนยันฟังก์ชันการทำงานของมันได้ ขอชื่นชมผู้เขียน! แม้ว่าคุณจะใช้งานได้ฟรี แต่โปรดจำไว้ว่าการเผยแพร่โค้ดซ้ำจะต้องเป็นไปตาม กฎระเบียบการใช้งาน ของเรา
คำจำกัดสิทธิ์ความรับผิดชอบ
ข้อมูลและบทความไม่ได้มีวัตถุประสงค์เพื่อก่อให้เกิดกิจกรรมทางการเงิน, การลงทุน, การซื้อขาย, ข้อเสนอแนะ หรือคำแนะนำประเภทอื่น ๆ ที่ให้หรือรับรองโดย TradingView อ่านเพิ่มเติมใน ข้อกำหนดการใช้งาน