INVITE-ONLY SCRIPT
Auto Fibonacci Retracement Levels
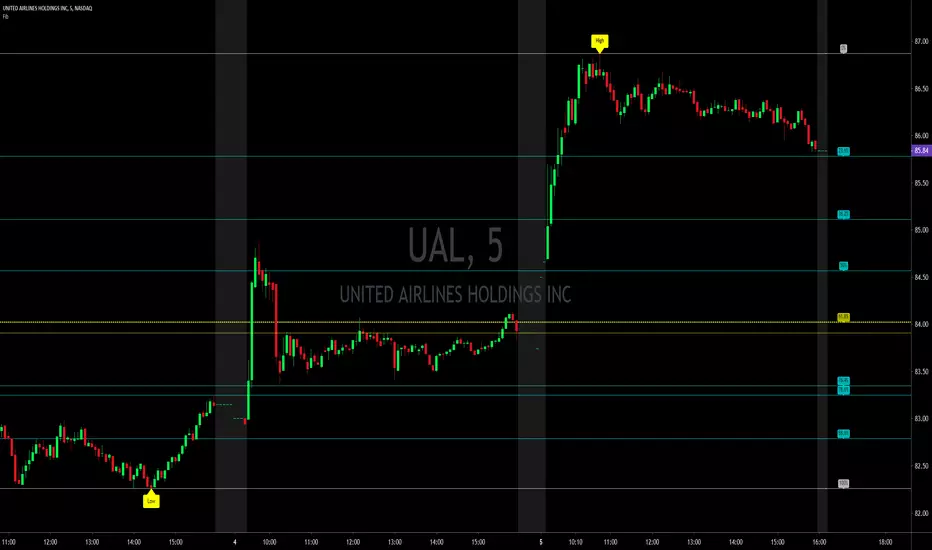
A Fibonacci retracement is a popular tool that traders can use to identify support and resistance levels, and place stop-loss orders or target prices.
The indicator connects any two points that are relevant, a high and low point.
The percentage levels provided are areas where the price could stall or reverse.
Levels should not be relied on exclusively. For example, it is dangerous to assume the price will reverse after hitting a specific Fibonacci level. It may, but it also may not.
Fibonacci retracement levels are most frequently used to provide potential areas of interest. If a trader wants to buy, they watch for the price to stall at a Fibonacci level and then bounce off that level before buying.
The most commonly used ratios include 23.6%, 38.2%, 50%, 61.8% and 78.6%. These represent how much of a prior move the price has corrected or retraced.
สคริปต์เฉพาะผู้ได้รับเชิญเท่านั้น
การเข้าถึงสคริปต์นี้จำกัดเฉพาะผู้ใช้ที่ได้รับอนุญาตจากผู้เขียน และมักจะต้องชำระเงินก่อน คุณสามารถเพิ่มลงในรายการโปรดของคุณได้ แต่คุณจะสามารถใช้งานได้หลังจากขออนุญาตและขอรับจากผู้เขียนเท่านั้น ติดต่อ DarkSideTrader สำหรับข้อมูลเพิ่มเติม หรือทำตามคำแนะนำของผู้เขียนด้านล่าง
TradingView ไม่แนะนำให้ชำระเงินสำหรับการซื้อสคริปต์และไม่แนะนำให้ใช้งานสคริปต์นั้นๆ จนกว่าคุณจะเชื่อมั่นในผู้เขียนสคริปต์ 100% และเข้าใจว่าสคริปต์ทำงานอย่างไร ในกรณีอื่นๆ คุณสามารถหาทางเลือกโอเพนซอร์สที่ดีได้ฟรีใน สคริปต์ชุมชน ของเรา
คำแนะนำของผู้เขียน
″
ต้องการที่จะใช้สคริปต์นี้บนชาร์ตใช่ไหม?
คำเตือน: กรุณาอ่าน ก่อนร้องขอการเข้าถึง
Follow us
Twitter twitter.com/darksidetrader
YouTube youtube.com/channel/UCAR8aMbticG9ePJrxeZ8mjw
Join Chat Room discord.gg/N4HSqJN96X
Website tradersofwallst.com
Live
9:00 AM EST to 2:30 PM EST
Twitter twitter.com/darksidetrader
YouTube youtube.com/channel/UCAR8aMbticG9ePJrxeZ8mjw
Join Chat Room discord.gg/N4HSqJN96X
Website tradersofwallst.com
Live
9:00 AM EST to 2:30 PM EST
คำจำกัดสิทธิ์ความรับผิดชอบ
ข้อมูลและบทความไม่ได้มีวัตถุประสงค์เพื่อก่อให้เกิดกิจกรรมทางการเงิน, การลงทุน, การซื้อขาย, ข้อเสนอแนะ หรือคำแนะนำประเภทอื่น ๆ ที่ให้หรือรับรองโดย TradingView อ่านเพิ่มเติมที่ ข้อกำหนดการใช้งาน