OPEN-SOURCE SCRIPT
ที่อัปเดต: 63-Day Sector Relative Strength vs NIFTY
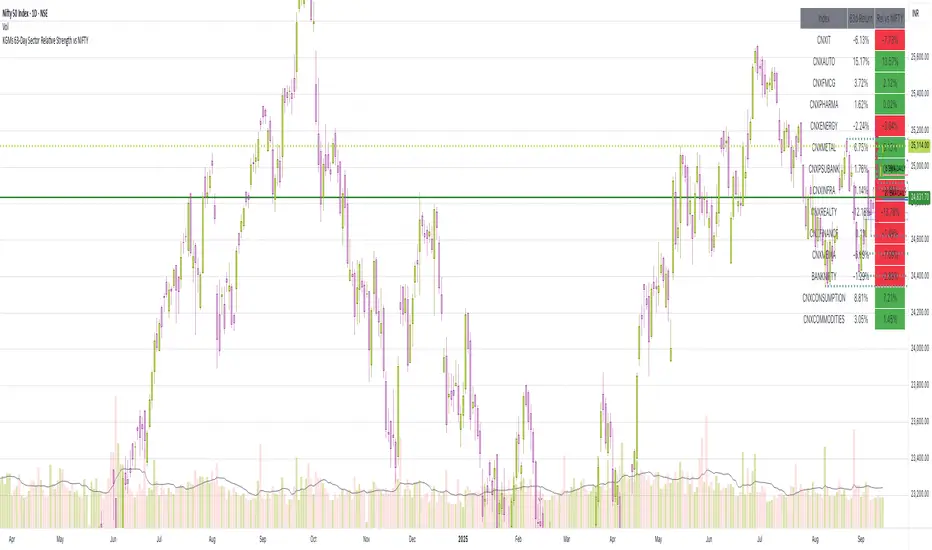
This script calculates and displays the 63-day returns of major NSE sectoral indices and their relative strength versus the NIFTY 50.
It,
Covered Indices: CNXIT, CNXAUTO, CNXFMCG, CNXPHARMA, CNXENERGY, CNXMETAL, CNXPSUBANK, CNXINFRA, CNXREALTY, CNXFINANCE, CNXMEDIA, BANKNIFTY, CNXCONSUMPTION, CNXCOMMODITIES
How to use this: Quickly identify which sectors are outperforming or underperforming relative to the NIFTY over the past 63 trading sessions (approx. 3 months).
It,
- [computes 63-day price returns for each sector index]
[calculates the relative performance of each sector against the Nifty 50]
[displays results in a table at the top right corner of the chart]
[highlights positive vs negative relative strength for quick comparision]
Covered Indices: CNXIT, CNXAUTO, CNXFMCG, CNXPHARMA, CNXENERGY, CNXMETAL, CNXPSUBANK, CNXINFRA, CNXREALTY, CNXFINANCE, CNXMEDIA, BANKNIFTY, CNXCONSUMPTION, CNXCOMMODITIES
How to use this: Quickly identify which sectors are outperforming or underperforming relative to the NIFTY over the past 63 trading sessions (approx. 3 months).
เอกสารเผยแพร่
This script calculates and displays the 63-day returns of major NSE sectoral indices and their relative strength versus the NIFTY 50.It,
- Computes 63-day price returns for each sector index.
- Calculates the relative performance of each sector against the NIFTY 50.
- Displays results in a neat table at the top-right corner of the chart.
- Highlights positive vs negative relative strength for quick comparison.
Covered Indices: CNXIT, CNXAUTO, CNXFMCG, CNXPHARMA, CNXENERGY, CNXMETAL, CNXPSUBANK, CNXINFRA, CNXREALTY, CNXFINANCE, CNXMEDIA, BANKNIFTY, CNXCONSUMPTION, CNXCOMMODITIES
Useful to quickly identify which sectors are outperforming or underperforming relative to the broader market (i.e. NIFTY) over the past 63 trading sessions (approx. 3 months). Useful for sector rotation analysis, relative momentum analysis and macro market views
สคริปต์โอเพนซอร์ซ
ด้วยเจตนารมณ์หลักของ TradingView ผู้สร้างสคริปต์นี้ได้ทำให้เป็นโอเพนซอร์ส เพื่อให้เทรดเดอร์สามารถตรวจสอบและยืนยันฟังก์ชันการทำงานของมันได้ ขอชื่นชมผู้เขียน! แม้ว่าคุณจะใช้งานได้ฟรี แต่โปรดจำไว้ว่าการเผยแพร่โค้ดซ้ำจะต้องเป็นไปตาม กฎระเบียบการใช้งาน ของเรา
คำจำกัดสิทธิ์ความรับผิดชอบ
ข้อมูลและบทความไม่ได้มีวัตถุประสงค์เพื่อก่อให้เกิดกิจกรรมทางการเงิน, การลงทุน, การซื้อขาย, ข้อเสนอแนะ หรือคำแนะนำประเภทอื่น ๆ ที่ให้หรือรับรองโดย TradingView อ่านเพิ่มเติมใน ข้อกำหนดการใช้งาน