OPEN-SOURCE SCRIPT
Roof and Floors From Actieve Inversiones
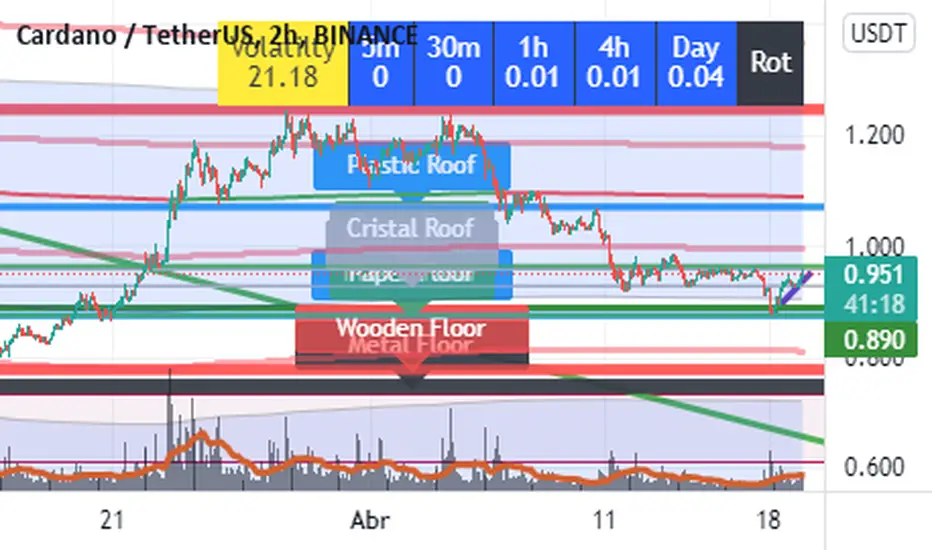
Imagine a Funny and visual way to understand Highest Highs and Lowest Lows. That's the way this indicator was conceived.
The way it Works:
The indicator plots lines in highest highs or lowest lows from a period of "Bars", you only have to set the number of Bars you wanna use and the indicator Makes all the stuff.
This is a Long term Indicator, so it can Show useful Floors or Roofs from higher Timeframes:
Cristal = Five Min Bars
Paper = thirty Min Bars
Plastic = 1 Hour Bars
Wood = 4 hours Bars
Metal = Daily Bars
But wait... There is something better than that...
If The Floor or Roof Brokes, the indicator will plot a dashed line and a label ¨Broken Roof or Floor¨ u can use it to set a Limit Order or Stop Order, and wait for the pullback.
Do you want some useful Advice ? Check the junctions from Floor or Roofs that are overlayed in some level.
Have Fun and good trading!!!
สคริปต์โอเพนซอร์ซ
ด้วยเจตนารมณ์หลักของ TradingView ผู้สร้างสคริปต์นี้ได้ทำให้เป็นโอเพนซอร์ส เพื่อให้เทรดเดอร์สามารถตรวจสอบและยืนยันฟังก์ชันการทำงานของมันได้ ขอชื่นชมผู้เขียน! แม้ว่าคุณจะใช้งานได้ฟรี แต่โปรดจำไว้ว่าการเผยแพร่โค้ดซ้ำจะต้องเป็นไปตาม กฎระเบียบการใช้งาน ของเรา
คำจำกัดสิทธิ์ความรับผิดชอบ
ข้อมูลและบทความไม่ได้มีวัตถุประสงค์เพื่อก่อให้เกิดกิจกรรมทางการเงิน, การลงทุน, การซื้อขาย, ข้อเสนอแนะ หรือคำแนะนำประเภทอื่น ๆ ที่ให้หรือรับรองโดย TradingView อ่านเพิ่มเติมใน ข้อกำหนดการใช้งาน