PROTECTED SOURCE SCRIPT
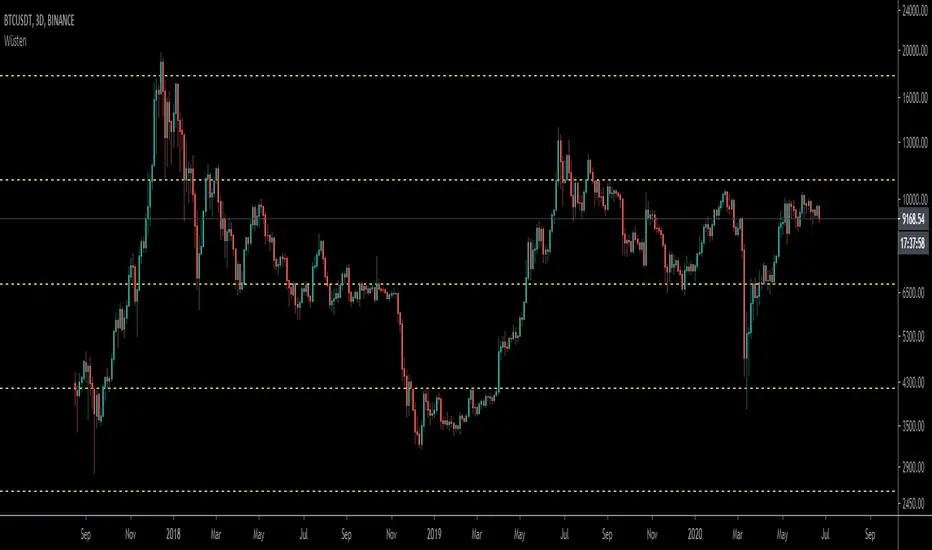
Wüsten

Plots Fibonacci Levels Automatically
Instruction to add it:
1) Click Below Right button: ADD TO FAVORITE SCRIPTS.
2) On your chart, click Indicators, search for Wusten
3) Once added on left go to settings.... Leave INPUT tab, click STYLE tab.
4) UN-TICK ALL PLOT boxes.
5) Scroll all the way down and at the very bottom left click DEFAULTS, and click SAVE AS DEFAULT.
(if you DON'T un-tick all PLOT boxes it draws another line on top of the dashed line for some reason).
6) The color should be as close to the one you wanted.
If not take time and correct the colors on the STYLE tab BUT remember to always go and click SAVE AS DEFAULT when done.
Then your colors will always stay like that.
สคริปต์ที่ได้รับการป้องกัน
สคริปต์นี้ถูกเผยแพร่เป็นแบบ closed-source อย่างไรก็ตาม คุณสามารถใช้ได้อย่างอิสระและไม่มีข้อจำกัดใดๆ – เรียนรู้เพิ่มเติมได้ที่นี่
คำจำกัดสิทธิ์ความรับผิดชอบ
ข้อมูลและบทความไม่ได้มีวัตถุประสงค์เพื่อก่อให้เกิดกิจกรรมทางการเงิน, การลงทุน, การซื้อขาย, ข้อเสนอแนะ หรือคำแนะนำประเภทอื่น ๆ ที่ให้หรือรับรองโดย TradingView อ่านเพิ่มเติมใน ข้อกำหนดการใช้งาน