OPEN-SOURCE SCRIPT
ShadowStats vs Official CPI YoY%
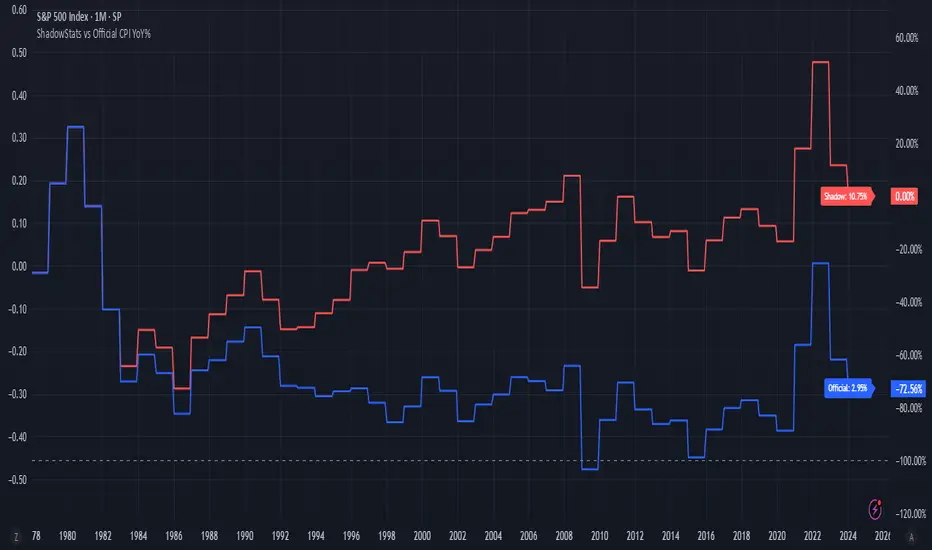
This chart visualizes and compares the year-over-year (YoY) percentage change in the Consumer Price Index (CPI) as calculated by the U.S. government versus the alternative methodology used by ShadowStats, which reflects pre-1980 inflation measurement techniques. The red line represents ShadowStats' CPI YoY% estimates, while the blue line shows the official CPI YoY% reported by government sources. This side-by-side view highlights the divergence in reported inflation rates over time, particularly from the 1980s onward, offering a visual representation of how different calculation methods can lead to vastly different interpretations of inflation and purchasing power loss.
สคริปต์โอเพนซอร์ซ
ด้วยเจตนารมณ์หลักของ TradingView ผู้สร้างสคริปต์นี้ได้ทำให้เป็นโอเพนซอร์ส เพื่อให้เทรดเดอร์สามารถตรวจสอบและยืนยันฟังก์ชันการทำงานของมันได้ ขอชื่นชมผู้เขียน! แม้ว่าคุณจะใช้งานได้ฟรี แต่โปรดจำไว้ว่าการเผยแพร่โค้ดซ้ำจะต้องเป็นไปตาม กฎระเบียบการใช้งาน ของเรา
คำจำกัดสิทธิ์ความรับผิดชอบ
ข้อมูลและบทความไม่ได้มีวัตถุประสงค์เพื่อก่อให้เกิดกิจกรรมทางการเงิน, การลงทุน, การซื้อขาย, ข้อเสนอแนะ หรือคำแนะนำประเภทอื่น ๆ ที่ให้หรือรับรองโดย TradingView อ่านเพิ่มเติมใน ข้อกำหนดการใช้งาน