MTF Momentum
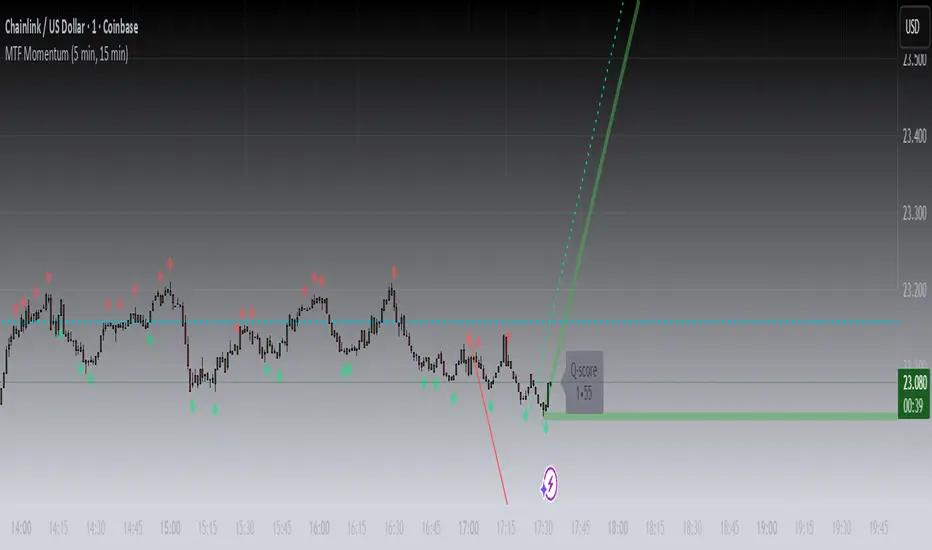
MTF Momentum is designed to provide true multiple-timeframe information at once on a single screen with as little clutter as possible. What makes MTF Momentum unique is the way it condenses the perspectives of our other internal models into a single bullish or bearish slope near the current candle, then automatically draws the same bullish or bearish momentum slopes of the next higher timeframes. The structure is engineered to highlight shifts in momentum as they happen on the current candle (angled lines), marking potential reversal points as they build (red and green diamonds), and provides a numerical Q-Score that draws a horizontal marker for elevated Q-Score exhaustion. The design avoids telling you when to buy or sell. Instead, it structures the raw inputs in a way that makes interpretation easier. That makes it useful whether you’re trading actively or simply learning to recognize how momentum flows across layers.
Usefulness:
This indicator is designed to work across multiple timeframes. Instead of juggling the same indicator on 3 different screens, you can see a unified picture that captures both the local momentum and higher timeframes that provide time-dimensional context. When short-term and higher-timeframe angles point in the same direction, MTF Momentum makes that visible in a straightforward way and may help highlight when momentum is consistent across multiple timeframes. When short-term layers push against a stronger higher timeframe, it signals that momentum may be shifting or exhausting. This indicator provides an efficient workflow and helps reduce clutter.
How It Works:
At its core, MTF Momentum is a blend of momentum readings from multiple sources — RSI slopes, EMA stacks, Gaussian smoothing, Fisher-style transforms, and MACD widening analysis built from the same shared core mathematical engines as our other indicators. The uniqueness of this indicator is not tied to any single formula as each component is well-known, but it is in the way they are layered, smoothed, and consolidated that entirely new readings are created.
The process begins with multiple RSI calculations, offset and averaged to reduce jitter. These are smoothed through EMA stacks of varying lengths, then run through Gaussian-style filters that emphasize directional change while filtering noise. The slope differences across these layers form the foundation of the momentum calculation. This momentum reading is then checked against MACD widening conditions. MACD gap expansion is treated as a momentum confirmation — widening gaps with price in agreement add weight, while narrowing gaps or misaligned candles reduce confidence. Additional derivative logic, including Fisher-style transforms, is applied to normalize the outputs and make them more stable across different assets.
Multi-timeframe integration comes from using request.security to pull higher timeframe versions of the same structures that are on the base chart. For example, you can see a one-minute chart overlaid with five-minute and fifteen-minute context. The blending is seamless — higher timeframe momentum is displayed alongside lower timeframe signals that help the user see where current timeframe momentum is in relation to higher timeframes.
How to Use the MTF Momentum Indicator:
Applying the MTF Momentum indicator is straightforward, but interpretation depends on your process.
To use, load the indicator on your preferred base timeframe. Use this general guideline to setup your indicators:
Base timeframe -> 1st HTF -> 2nd HTF
1min -> 5min -> 15min
5min -> 15min -> 1hr
15min -> 1hr -> 4hr
1hr -> 4hr -> 1day
4hr -> 1day -> Weekly
1day -> Weekly -> Monthly
Weekly -> Monthly -> Yearly
When used at base timeframes at 1 hour or lower, higher timeframe lines ARE drawn automatically.
When using a base timeframe above 1 hour (e.g., 4h, Daily), higher-timeframe slopes are NOT drawn automatically. To view them, switch to the higher-timeframe chart itself (for example, Daily or Weekly) and draw an arrow along the slope using TradingView’s drawing tools. Once placed, the arrow will remain visible when you return to your lower base timeframe chart, giving you the higher-timeframe context alongside your current view. This step is optional, purely for visual reference, and does not affect the indicator’s calculations.
These are your higher timeframe momentum angles that can help provide context to the automatically drawn angle on your current timeframe. You can even practice drawing these lines on the lower timeframes such as using a 5min base and 15min and 1hr HTF charts. You can compare your manually drawn angles with the automatic HTF lines by enabling them in the INPUTS tab of the MTF Momentum settings menu.
Q-SCORE:
The Q-Score label presents two values ranging from 0 to 100. These values are a numerical translation of the same momentum conditions our other indicators display visually. Higher values indicate stronger readings of exhaustion within the current trend model, while lower values indicate less. You can think of this as similar to a distribution curve, where some states occur less frequently at the extreme ends of the range and more frequently near the middle. Q-Score values are provided as contextual information only and do not predict reversals or guarantee outcomes.
Blue Dotted & Solid Horizontal line:
The aqua blue horizontal line is a visual representation of the Q-Score values. When one or both numerical values is below 85 the line stays dotted -- it is only when both numerical values exceed 85 that the line changes from dotted to solid.
Green & Red Diamonds:
Diamonds mark areas where the underlying model detects counter-trend behavior. They may flicker on the current candle during intrabar calculations but are locked in at candle close and never get altered or repainted.
Red diamonds highlight points where the model detects counter-trend pressure during a bullish phase. Green diamonds highlight counter-trend pressure during a bearish phase. These markers reflect where momentum conditions have shifted relative to the prevailing trend. They appear where short-term dynamics differ from the broader trend. Traders can interpret these areas in their own context; the diamonds themselves do not predict reversals or guarantee outcomes.
Example ways to use the MTF Momentum indicator:
Look for agreement -- when both your base timeframe and higher timeframe momentums are pointing in the same direction, it reflects stronger alignment. This may help identify areas of trend continuation.
Watch for divergence -- if your short-term momentum pushes opposite to the higher timeframe, it flags a potential transition.
Disclaimer:
This tool does not generate buy or sell signals. It is a framework for visualizing momentum across layers, allowing you to incorporate that information into your own decision-making. How you apply it depends entirely on your goals, timeframe, and risk tolerance. This indicator is provided for educational and informational purposes only. It does not constitute financial advice, trading advice, or investment recommendations. Trading involves risk, and you may lose some or all of your capital. Past performance is not a guarantee of future results. You are solely responsible for any decisions you make — always trade to the best of your own abilities and within your own risk tolerance.
Release Notes:
v1.0 (Initial Release)
สคริปต์แบบเฉพาะผู้ได้รับเชิญเท่านั้น
เฉพาะผู้ใช้งานที่ผู้เขียนอนุมัตเท่านั้นจึงจะสามารถเข้าถึงสคริปต์นี้ได้ คุณจะต้องขอและได้รับอนุญาตก่อนใช้งาน ซึ่งโดยทั่วไปจะได้รับอนุญาตหลังจากชำระเงินแล้ว สำหรับรายละเอียดเพิ่มเติม โปรดทำตามคำแนะนำของผู้เขียนด้านล่าง หรือติดต่อ Predator-Trading-Systems โดยตรง
TradingView ไม่แนะนำให้จ่ายเงินหรือใช้สคริปต์ เว้นแต่คุณจะเชื่อถือผู้เขียนและเข้าใจวิธีการทำงานของสคริปต์นั้นอย่างถ่องแท้ คุณยังสามารถหาทางเลือกแบบโอเพนซอร์สฟรีได้ใน สคริปต์ชุมชนของเรา
คำแนะนำของผู้เขียน
คำจำกัดสิทธิ์ความรับผิดชอบ
สคริปต์แบบเฉพาะผู้ได้รับเชิญเท่านั้น
เฉพาะผู้ใช้งานที่ผู้เขียนอนุมัตเท่านั้นจึงจะสามารถเข้าถึงสคริปต์นี้ได้ คุณจะต้องขอและได้รับอนุญาตก่อนใช้งาน ซึ่งโดยทั่วไปจะได้รับอนุญาตหลังจากชำระเงินแล้ว สำหรับรายละเอียดเพิ่มเติม โปรดทำตามคำแนะนำของผู้เขียนด้านล่าง หรือติดต่อ Predator-Trading-Systems โดยตรง
TradingView ไม่แนะนำให้จ่ายเงินหรือใช้สคริปต์ เว้นแต่คุณจะเชื่อถือผู้เขียนและเข้าใจวิธีการทำงานของสคริปต์นั้นอย่างถ่องแท้ คุณยังสามารถหาทางเลือกแบบโอเพนซอร์สฟรีได้ใน สคริปต์ชุมชนของเรา