OPEN-SOURCE SCRIPT
CHK 3TIMEFRAME RSI OB-OS SCREENER
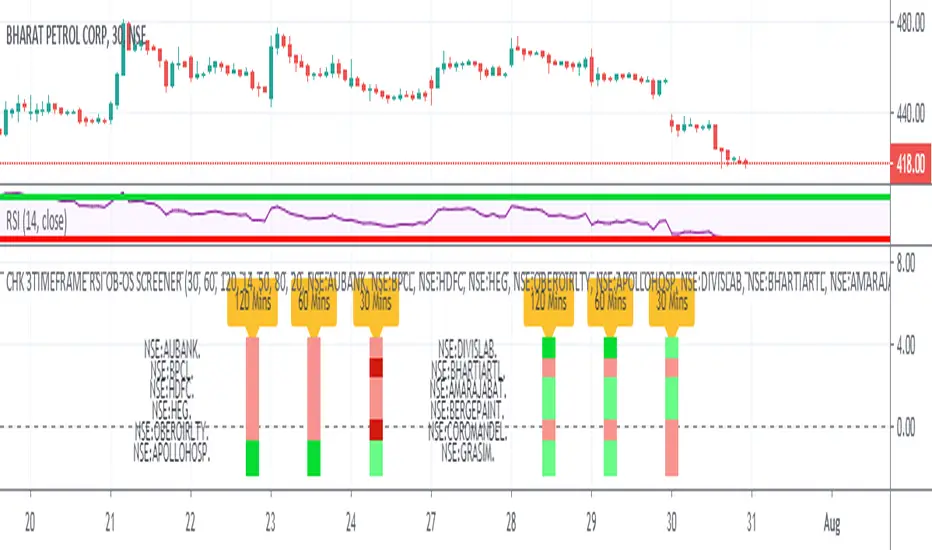
Sharing RSI Screener. It shows RSI Situation for 12 Stocks.
User can replace the stocks as per their respective exchange
User can select 3 Time Frames of his/her choice
User can change the OverBought / OverSold Values to 70/30. This indicator uses 80/20.
RSI BELOW 50 = PINK COLOR
OVERSOLD = MAROON COLOR
RSI ABOVE 50 = LIGHT GREEN COLOR
OVERBOUGHT = DARK GREEN COLOR
For Example : This Chart and the Indicator snapshot shows, the stock BPCL is Oversold for the 30 Min TimeFrame
For Example : The indicator snapshot shows, the stocks HDFC and AUBANK have their RSI's below 50 across the 30 Min / 60 Min / 120 Min
TimeFrames
Please give it some time to load, and every time you change Resolution.
Add another one, to have a screener screening 24 stocks :)
สคริปต์โอเพนซอร์ซ
ด้วยเจตนารมณ์หลักของ TradingView ผู้สร้างสคริปต์นี้ได้ทำให้เป็นโอเพนซอร์ส เพื่อให้เทรดเดอร์สามารถตรวจสอบและยืนยันฟังก์ชันการทำงานของมันได้ ขอชื่นชมผู้เขียน! แม้ว่าคุณจะใช้งานได้ฟรี แต่โปรดจำไว้ว่าการเผยแพร่โค้ดซ้ำจะต้องเป็นไปตาม กฎระเบียบการใช้งาน ของเรา
คำจำกัดสิทธิ์ความรับผิดชอบ
ข้อมูลและบทความไม่ได้มีวัตถุประสงค์เพื่อก่อให้เกิดกิจกรรมทางการเงิน, การลงทุน, การซื้อขาย, ข้อเสนอแนะ หรือคำแนะนำประเภทอื่น ๆ ที่ให้หรือรับรองโดย TradingView อ่านเพิ่มเติมใน ข้อกำหนดการใช้งาน