OPEN-SOURCE SCRIPT
ที่อัปเดต: Market Monitor
Overview
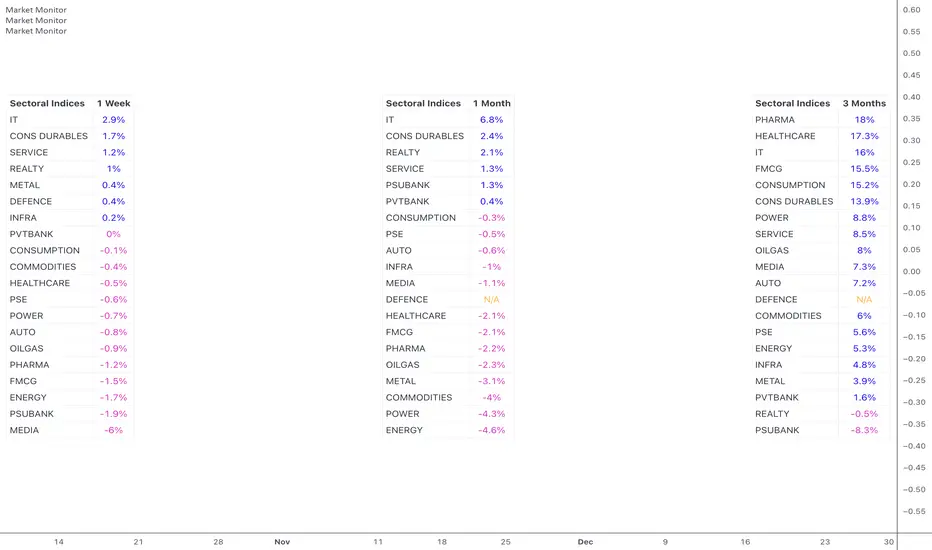
The Market Monitor Indicator provides a customisable view of dynamic percentage changes across selected indices or sectors, calculated by comparing current and previous closing prices over the chosen timeframe.
Key Features

Customisation
Use Cases
The Market Monitor Indicator provides a customisable view of dynamic percentage changes across selected indices or sectors, calculated by comparing current and previous closing prices over the chosen timeframe.
Key Features
- Choose up to 20 predefined indices or your own selected indices/stocks.
- Use checkboxes to show or hide individual entries.
- Monitor returns over daily, weekly, monthly, quarterly, half-yearly, or yearly timeframes
- Sort by returns (descending) to quickly identify top-performing indices or alphabetically for an organised and systematic review.
Customisation
- Switch between Light Mode (Blue or Green themes) and Dark Mode for visual clarity.
- Adjust the table’s size, position, and location.
- Customise the table title to your own choice e.g. Sectoral, Broad, Portfolio etc.
Use Cases
- Use multiple instances of the script with varying timeframes to study sectoral rotation and trends.
- Customise the stocks to see your portfolio returns for the day or over the past week, or longer.
เอกสารเผยแพร่
- Option to give custom titles to chosen indices. Can be used when a spread of stocks is used to create a custom index.
- Ascending sorting also added.
- Alphabetical sorting disabled for custom titles.
เอกสารเผยแพร่
- The script can now be shifted horizontally using a custom offfset value. This allows us more than 3 iterations of the table on one chart using multiple script instances.
- Alphabetical sorting is now possible in custom names too.
สคริปต์โอเพนซอร์ซ
ด้วยเจตนารมณ์หลักของ TradingView ผู้สร้างสคริปต์นี้ได้ทำให้เป็นโอเพนซอร์ส เพื่อให้เทรดเดอร์สามารถตรวจสอบและยืนยันฟังก์ชันการทำงานของมันได้ ขอชื่นชมผู้เขียน! แม้ว่าคุณจะใช้งานได้ฟรี แต่โปรดจำไว้ว่าการเผยแพร่โค้ดซ้ำจะต้องเป็นไปตาม กฎระเบียบการใช้งาน ของเรา
คำจำกัดสิทธิ์ความรับผิดชอบ
ข้อมูลและบทความไม่ได้มีวัตถุประสงค์เพื่อก่อให้เกิดกิจกรรมทางการเงิน, การลงทุน, การซื้อขาย, ข้อเสนอแนะ หรือคำแนะนำประเภทอื่น ๆ ที่ให้หรือรับรองโดย TradingView อ่านเพิ่มเติมใน ข้อกำหนดการใช้งาน