Dynamic RSI Columns
Key Features:
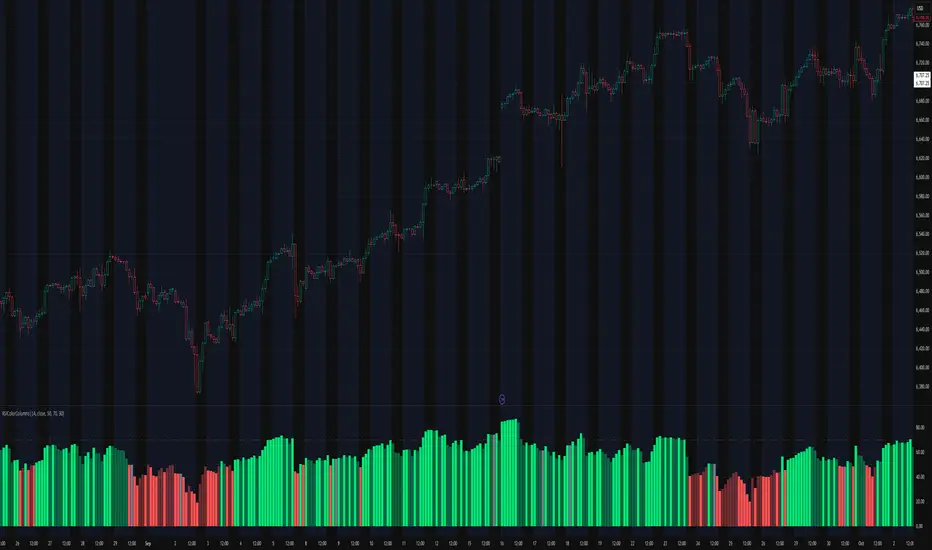
- Customizable Midpoint: Adjust the reference level (default 50) to match your trading strategy. The indicator automatically adapts column coloring based on your chosen midpoint.
- Dynamic Coloring: Columns change color according to trend direction and position relative to the midpoint:
Above midpoint & rising → bright green
Above midpoint & falling → pale green
Below midpoint & falling → bright red
Below midpoint & rising → pale red
Unchanged → grey - Optional RSI Line: Overlay a traditional RSI line for added clarity.
- Overbought / Oversold Levels: Visual guides to quickly identify extreme market conditions.
- Background Highlights: Optional shading when RSI enters overbought or oversold zones.
Why Use It:
Designed for traders seeking a fast, visual way to assess momentum, this indicator works on multiple timeframes and supports both trend-following and mean-reversion strategies.
Invite-Only Access:
This is a premium invite-only indicator. Redistribution or sharing of this script is strictly prohibited. Access is granted only via direct approval by IndicatorEliteFlow.
Disclaimer:
Trading involves substantial risk and is not suitable for every investor. Dynamic RSI Columns is a technical analysis tool and does not constitute financial, investment, or trading advice. Users are solely responsible for their trading decisions and risk management. Past performance is not indicative of future results, and no guarantees are made regarding the accuracy, completeness, or reliability of the information provided.
By using this indicator, you acknowledge and accept that:
- You are trading at your own risk.
- You will not hold IndicatorEliteFlow liable for any trading losses or damages.
- The indicator is provided “as-is” for educational and analytical purposes only.
- You should seek independent financial advice before making any investment decisions.
สคริปต์แบบเฉพาะผู้ได้รับเชิญเท่านั้น
เฉพาะผู้ใช้ที่ได้รับการอนุมัติจากผู้เขียนเท่านั้นที่สามารถเข้าถึงสคริปต์นี้ได้ คุณจะต้องร้องขอและได้รับอนุญาตก่อนจึงจะสามารถใช้งานได้ โดยปกติจะได้รับอนุญาตหลังจากชำระเงินแล้ว สำหรับรายละเอียดเพิ่มเติม ทำตามคำแนะนำของผู้เขียนด้านล่างหรือติดต่อ IndicatorEliteFlow โดยตรง
TradingView ไม่แนะนำให้ชำระเงินหรือใช้สคริปต์ เว้นแต่ว่าคุณจะเชื่อถือผู้เขียนสคริปต์และเข้าใจวิธีการทำงานของมัน คุณยังอาจพบทางเลือกของโอเพนซอร์ส แบบฟรีในสคริปต์ชุมชนของเรา
คำแนะนำของผู้เขียน
คำจำกัดสิทธิ์ความรับผิดชอบ
สคริปต์แบบเฉพาะผู้ได้รับเชิญเท่านั้น
เฉพาะผู้ใช้ที่ได้รับการอนุมัติจากผู้เขียนเท่านั้นที่สามารถเข้าถึงสคริปต์นี้ได้ คุณจะต้องร้องขอและได้รับอนุญาตก่อนจึงจะสามารถใช้งานได้ โดยปกติจะได้รับอนุญาตหลังจากชำระเงินแล้ว สำหรับรายละเอียดเพิ่มเติม ทำตามคำแนะนำของผู้เขียนด้านล่างหรือติดต่อ IndicatorEliteFlow โดยตรง
TradingView ไม่แนะนำให้ชำระเงินหรือใช้สคริปต์ เว้นแต่ว่าคุณจะเชื่อถือผู้เขียนสคริปต์และเข้าใจวิธีการทำงานของมัน คุณยังอาจพบทางเลือกของโอเพนซอร์ส แบบฟรีในสคริปต์ชุมชนของเรา