ETH MVRV Z Score
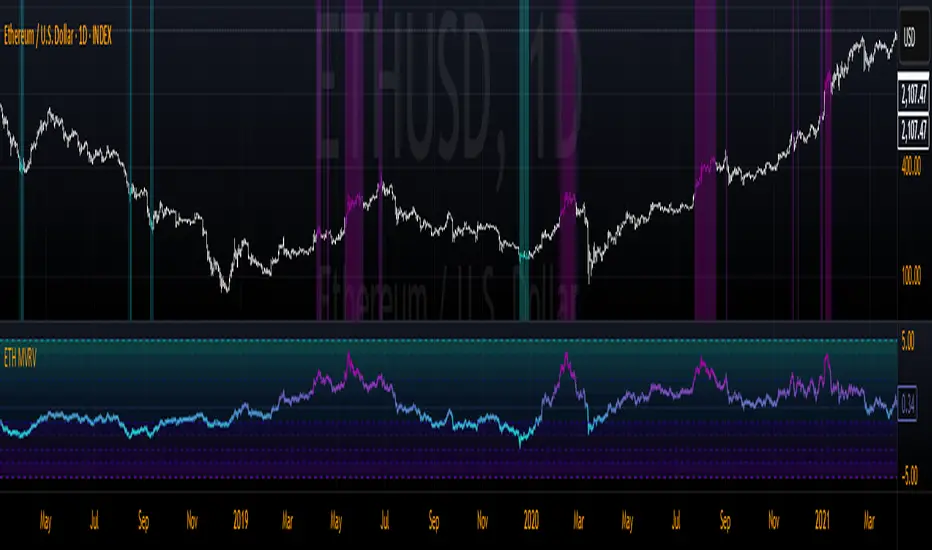
The indicator calculates the Z-score of the MVRV ratio over a user-defined lookback period, visually representing how far the current MVRV deviates from its mean in terms of standard deviations. It features customizable overbought and oversold thresholds, a gradient-based color system for easy interpretation, and optional chart coloring to highlight key market conditions. Horizontal lines and filled zones provide additional context for interpreting the Z-score levels, ranging from extreme undervaluation to extreme overvaluation.
Key Features:
- Z-Score Calculation: Measures the deviation of ETH’s MVRV ratio from its historical average, normalized by standard deviation.
- Customizable Settings: Adjust the lookback length for the Z-score calculation, as well as overbought and oversold thresholds.
- Color Gradient: Visualizes the Z-score with a smooth gradient, transitioning between user-defined colors for oversold, neutral, and overbought states.
- Optional Chart Colors: When enabled, applies dynamic coloring to candlesticks and backgrounds based on the Z-score, enhancing visual analysis.
- Horizontal Levels: Displays predefined Z-score levels (from -5 to 5) with shaded zones to mark significant thresholds.
Inputs:
- Z Length: The lookback period for calculating the Z-score (default: 150).
- Overbought Z Score: The threshold above which ETH is considered overbought (default: 2).
- Oversold Z Score: The threshold below which ETH is considered oversold (default: -2).
- Chart Colors: Toggle to enable/disable dynamic candlestick and background coloring.
- Color Options: Customize colors for oversold, overbought, and neutral zones.
How to Use:
A Z-score above the overbought threshold (e.g., 2) may suggest ETH is overvalued, potentially signaling a selling opportunity.
A Z-score below the oversold threshold (e.g., -2) may indicate undervaluation, potentially signaling a buying opportunity.
The gradient and optional chart colors help quickly identify market conditions, while the horizontal lines provide reference points for extreme deviations.
Best For:
- Long-term investors assessing ETH’s valuation.
- Traders looking for mean-reversion opportunities.
- Analysts combining on-chain metrics with technical analysis.
สคริปต์แบบเฉพาะผู้ได้รับเชิญเท่านั้น
เฉพาะผู้ใช้งานที่ผู้เขียนอนุมัตเท่านั้นจึงจะสามารถเข้าถึงสคริปต์นี้ได้ คุณจะต้องขอและได้รับอนุญาตก่อนใช้งาน ซึ่งโดยทั่วไปจะได้รับอนุญาตหลังจากชำระเงินแล้ว สำหรับรายละเอียดเพิ่มเติม โปรดทำตามคำแนะนำของผู้เขียนด้านล่าง หรือติดต่อ MarktQuant โดยตรง
โปรดทราบว่าสคริปต์แบบเฉพาะผู้ได้รับเชิญส่วนตัวนี้ไม่ได้ถูกตรวจสอบโดยผู้ดูแลสคริปต์ และยังไม่มีการกำหนดว่าสคริปต์นี้จะสอดคล้องกับกฎระเบียบการใช้งานหรือไม่ TradingView ไม่แนะนำให้จ่ายเงินหรือใช้สคริปต์ เว้นแต่คุณจะเชื่อถือผู้เขียนและเข้าใจวิธีการทำงานของสคริปต์นั้นอย่างถ่องแท้ คุณยังสามารถหาทางเลือกแบบโอเพนซอร์สฟรีได้ใน สคริปต์ชุมชนของเรา
คำแนะนำของผู้เขียน
📊 whop.com/marktquant
🌐 marktquant.com
Nothing shared on this page constitutes financial advice. All information, tools, and analyses are provided solely for informational and educational purposes.
คำจำกัดสิทธิ์ความรับผิดชอบ
สคริปต์แบบเฉพาะผู้ได้รับเชิญเท่านั้น
เฉพาะผู้ใช้งานที่ผู้เขียนอนุมัตเท่านั้นจึงจะสามารถเข้าถึงสคริปต์นี้ได้ คุณจะต้องขอและได้รับอนุญาตก่อนใช้งาน ซึ่งโดยทั่วไปจะได้รับอนุญาตหลังจากชำระเงินแล้ว สำหรับรายละเอียดเพิ่มเติม โปรดทำตามคำแนะนำของผู้เขียนด้านล่าง หรือติดต่อ MarktQuant โดยตรง
โปรดทราบว่าสคริปต์แบบเฉพาะผู้ได้รับเชิญส่วนตัวนี้ไม่ได้ถูกตรวจสอบโดยผู้ดูแลสคริปต์ และยังไม่มีการกำหนดว่าสคริปต์นี้จะสอดคล้องกับกฎระเบียบการใช้งานหรือไม่ TradingView ไม่แนะนำให้จ่ายเงินหรือใช้สคริปต์ เว้นแต่คุณจะเชื่อถือผู้เขียนและเข้าใจวิธีการทำงานของสคริปต์นั้นอย่างถ่องแท้ คุณยังสามารถหาทางเลือกแบบโอเพนซอร์สฟรีได้ใน สคริปต์ชุมชนของเรา
คำแนะนำของผู้เขียน
📊 whop.com/marktquant
🌐 marktquant.com
Nothing shared on this page constitutes financial advice. All information, tools, and analyses are provided solely for informational and educational purposes.