PROTECTED SOURCE SCRIPT
BTC: aSOPR Overheated Signal
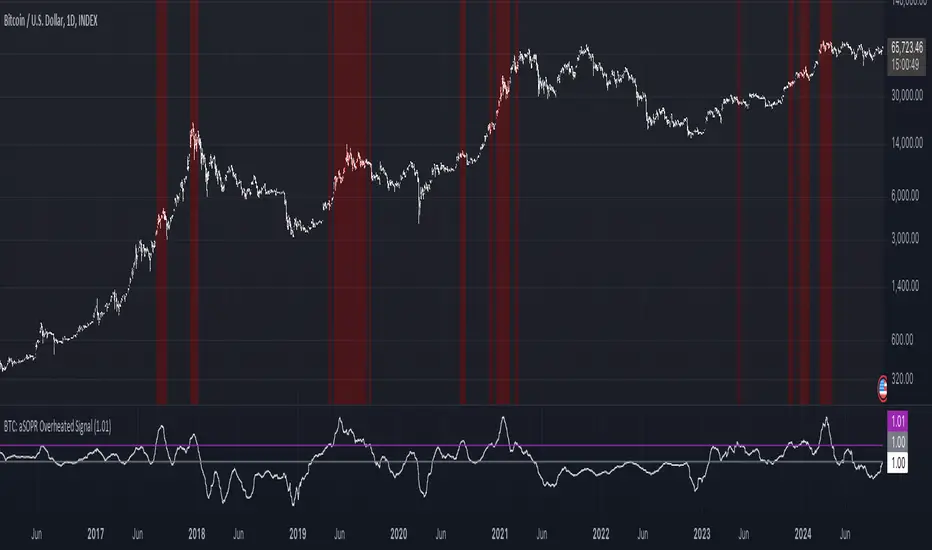
BTC: Adjusted Spent Output Profit Ratio (aSOPR) Overheated Signal
Calculation:
Adjusted SOPR is calculated by the 30 day moving average divided by the 365 day moving average of SOPR.
Function:
When the aSOPR is above the upper threshold line (default = 1.01), this signals an overheated market, where participants are realising their gains.
Best Use:
On the 1D Chart. Used in combination with a variety of other tools for analysis to identify overheated market conditions.
สคริปต์ที่ได้รับการป้องกัน
สคริปต์นี้ถูกเผยแพร่เป็นแบบ closed-source อย่างไรก็ตาม คุณสามารถใช้ได้อย่างอิสระและไม่มีข้อจำกัดใดๆ – เรียนรู้เพิ่มเติมได้ที่นี่
คำจำกัดสิทธิ์ความรับผิดชอบ
ข้อมูลและบทความไม่ได้มีวัตถุประสงค์เพื่อก่อให้เกิดกิจกรรมทางการเงิน, การลงทุน, การซื้อขาย, ข้อเสนอแนะ หรือคำแนะนำประเภทอื่น ๆ ที่ให้หรือรับรองโดย TradingView อ่านเพิ่มเติมใน ข้อกำหนดการใช้งาน