OPEN-SOURCE SCRIPT
Spread Rebalance Simulation
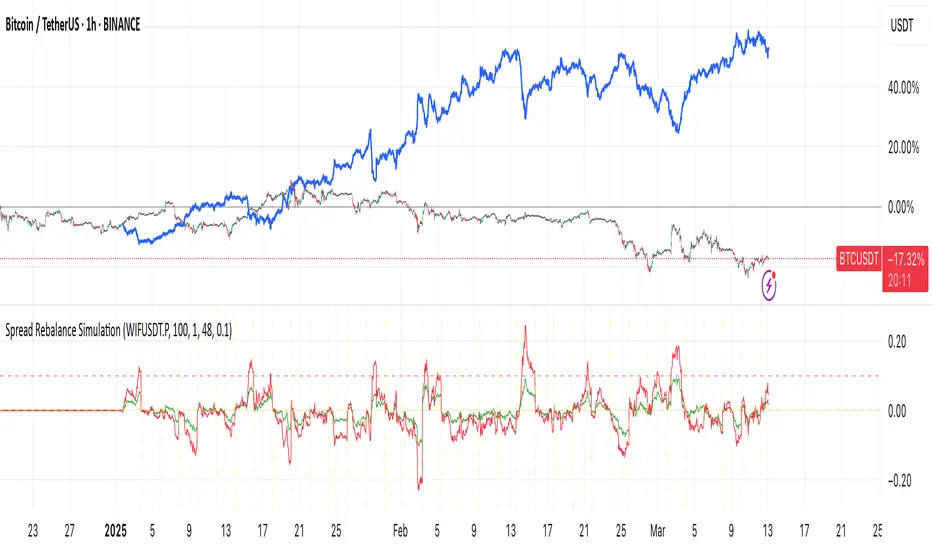
The Spread Rebalance Simulator is a tool designed to help visualize the effect of rebalancing on spread trading returns. Typically, TradingView charts are used to display spread charts, but this method assumes that the ratio remains unchanged on each bar. In real trading scenarios, the ratio constantly changes, and this indicator allows traders to see a more accurate representation of spread trading.
The next version will include support for input ratio and trading cost.
To use this simply select any chart (as a long pair) then fill the symbol name for the short pair. Then choose the rebalance period. The blue line will show you the equity of this pair combination.
The next version will include support for input ratio and trading cost.
To use this simply select any chart (as a long pair) then fill the symbol name for the short pair. Then choose the rebalance period. The blue line will show you the equity of this pair combination.
สคริปต์โอเพนซอร์ซ
ด้วยเจตนารมณ์หลักของ TradingView ผู้สร้างสคริปต์นี้ได้ทำให้เป็นโอเพนซอร์ส เพื่อให้เทรดเดอร์สามารถตรวจสอบและยืนยันฟังก์ชันการทำงานของมันได้ ขอชื่นชมผู้เขียน! แม้ว่าคุณจะใช้งานได้ฟรี แต่โปรดจำไว้ว่าการเผยแพร่โค้ดซ้ำจะต้องเป็นไปตาม กฎระเบียบการใช้งาน ของเรา
คำจำกัดสิทธิ์ความรับผิดชอบ
ข้อมูลและบทความไม่ได้มีวัตถุประสงค์เพื่อก่อให้เกิดกิจกรรมทางการเงิน, การลงทุน, การซื้อขาย, ข้อเสนอแนะ หรือคำแนะนำประเภทอื่น ๆ ที่ให้หรือรับรองโดย TradingView อ่านเพิ่มเติมใน ข้อกำหนดการใช้งาน