I'm not 100% satisfied with the strategy performance output I receive from TradingView. Quite often I want to see something that is not available by default. I usually export raw trades/metrics from TradingView and then do additional analysis manually.
But with tables, you can build additional metrics and tools for your strategies quite easily.
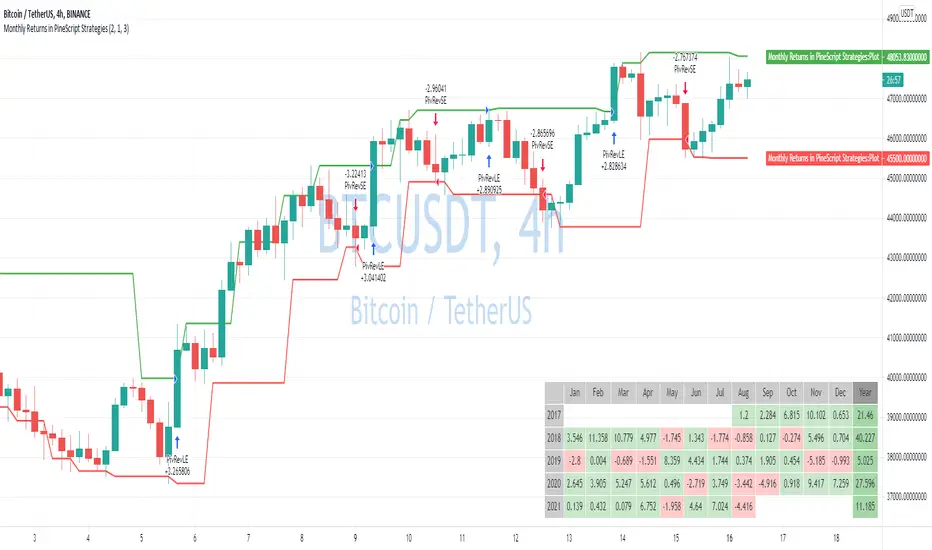
This script will just show a table with monthly/yearly performance of your script. Quite a lot of traders/investors used to look at returns like that. Also, it might help you to identify periods of time when your strategy performed good/bad than expected and try to analyze that better.
The script is very simple and I believe you can easily apply it to your own strategies.
Disclaimer
Please remember that past performance may not be indicative of future results.
Due to various factors, including changing market conditions, the strategy may no longer perform as well as in historical backtesting.
This post and the script don’t provide any financial advice.
But with tables, you can build additional metrics and tools for your strategies quite easily.
This script will just show a table with monthly/yearly performance of your script. Quite a lot of traders/investors used to look at returns like that. Also, it might help you to identify periods of time when your strategy performed good/bad than expected and try to analyze that better.
The script is very simple and I believe you can easily apply it to your own strategies.
Disclaimer
Please remember that past performance may not be indicative of future results.
Due to various factors, including changing market conditions, the strategy may no longer perform as well as in historical backtesting.
This post and the script don’t provide any financial advice.
เอกสารเผยแพร่
Fixed bug with new bars updatesสคริปต์โอเพนซอร์ซ
ด้วยเจตนารมณ์หลักของ TradingView ผู้สร้างสคริปต์นี้ได้ทำให้เป็นโอเพนซอร์ส เพื่อให้เทรดเดอร์สามารถตรวจสอบและยืนยันฟังก์ชันการทำงานของมันได้ ขอชื่นชมผู้เขียน! แม้ว่าคุณจะใช้งานได้ฟรี แต่โปรดจำไว้ว่าการเผยแพร่โค้ดซ้ำจะต้องเป็นไปตาม กฎระเบียบการใช้งาน ของเรา
💻 Online Courses and Access to PRO Indicators in the QuanTribe community: qntly.com/qt
💼 Hire Us: qntly.com/pine
📞 Book a call: qntly.com/cons
📰 qntly.com/news
𝕏: qntly.com/x
📩 qntly.com/tel
💼 Hire Us: qntly.com/pine
📞 Book a call: qntly.com/cons
📰 qntly.com/news
𝕏: qntly.com/x
📩 qntly.com/tel
คำจำกัดสิทธิ์ความรับผิดชอบ
ข้อมูลและบทความไม่ได้มีวัตถุประสงค์เพื่อก่อให้เกิดกิจกรรมทางการเงิน, การลงทุน, การซื้อขาย, ข้อเสนอแนะ หรือคำแนะนำประเภทอื่น ๆ ที่ให้หรือรับรองโดย TradingView อ่านเพิ่มเติมใน ข้อกำหนดการใช้งาน
สคริปต์โอเพนซอร์ซ
ด้วยเจตนารมณ์หลักของ TradingView ผู้สร้างสคริปต์นี้ได้ทำให้เป็นโอเพนซอร์ส เพื่อให้เทรดเดอร์สามารถตรวจสอบและยืนยันฟังก์ชันการทำงานของมันได้ ขอชื่นชมผู้เขียน! แม้ว่าคุณจะใช้งานได้ฟรี แต่โปรดจำไว้ว่าการเผยแพร่โค้ดซ้ำจะต้องเป็นไปตาม กฎระเบียบการใช้งาน ของเรา
💻 Online Courses and Access to PRO Indicators in the QuanTribe community: qntly.com/qt
💼 Hire Us: qntly.com/pine
📞 Book a call: qntly.com/cons
📰 qntly.com/news
𝕏: qntly.com/x
📩 qntly.com/tel
💼 Hire Us: qntly.com/pine
📞 Book a call: qntly.com/cons
📰 qntly.com/news
𝕏: qntly.com/x
📩 qntly.com/tel
คำจำกัดสิทธิ์ความรับผิดชอบ
ข้อมูลและบทความไม่ได้มีวัตถุประสงค์เพื่อก่อให้เกิดกิจกรรมทางการเงิน, การลงทุน, การซื้อขาย, ข้อเสนอแนะ หรือคำแนะนำประเภทอื่น ๆ ที่ให้หรือรับรองโดย TradingView อ่านเพิ่มเติมใน ข้อกำหนดการใช้งาน