OPEN-SOURCE SCRIPT
ที่อัปเดต: Revolver Oscillator Strategy 1.2 (RSI+UO+MFI)
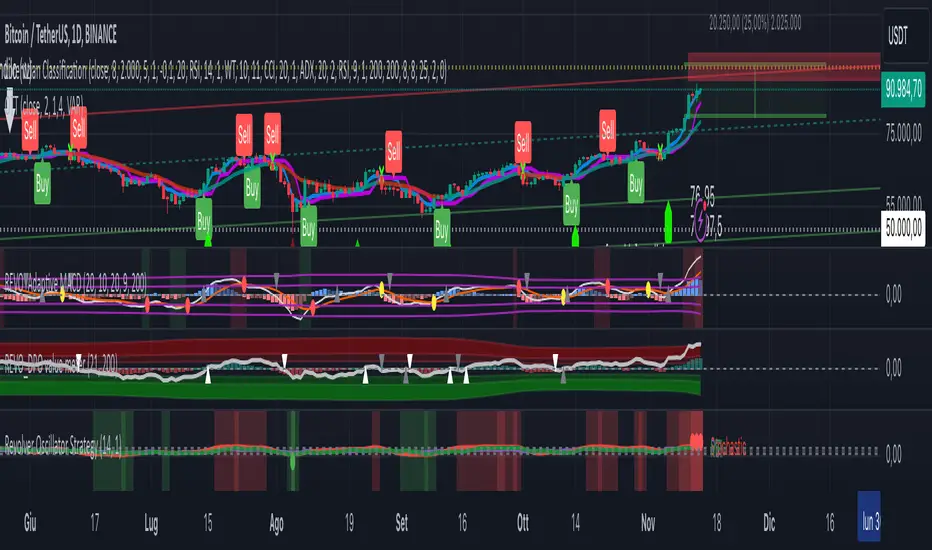
ROS (Revolver Oscillator Strategy)
Version 1.2
Description
This script combines three popular oscillators (RSI, Ultimate Oscillator and MFI) to accurately determine the price momentum of an asset.
Context
- RSI (Relative Strength Index) is a momentum oscillator that measures the speed and change of price movements over a period of time (14).
- Ultimate Oscillator uses three different periods (7, 14, and 28) to represent short, medium, and long-term market trends.
- Money Flow Index (MFI) is a momentum indicator that measures the flow of money into and out over a period of time. It is related to the Relative Strength Index (RSI) but incorporates volume, whereas the RSI only considers price
How does it work?
When a RED bar appears, it means that the three oscillators have exceeded the set thresholds, and it is a SELL signal.
When a GREEN bar appears, it means that the three oscillators are below the set thresholds, and it is a BUY signal.
I recommend leaving the default settings.
เอกสารเผยแพร่
Fixed some bugsเอกสารเผยแพร่
New color codesRSI: purple line
Ultimate Oscillator: red line
Money Flow Index: green line
เอกสารเผยแพร่
Added a swith to deactivate MFI in the strategy calculation.เอกสารเผยแพร่
Added a swith to deactivate ULT in the strategy calculation.เอกสารเผยแพร่
Improvements in the UI.เอกสารเผยแพร่
Improvements in the UI.เอกสารเผยแพร่
Various improvements in the interfaceเอกสารเผยแพร่
Updated oscillator algoritmเอกสารเผยแพร่
General UpdateAdded QQE oscillator
เอกสารเผยแพร่
Added green/red dots to indicate extreme areasAdded median wave (thanks to Fab_Coin_ )
สคริปต์โอเพนซอร์ซ
ด้วยเจตนารมณ์หลักของ TradingView ผู้สร้างสคริปต์นี้ได้ทำให้เป็นโอเพนซอร์ส เพื่อให้เทรดเดอร์สามารถตรวจสอบและยืนยันฟังก์ชันการทำงานของมันได้ ขอชื่นชมผู้เขียน! แม้ว่าคุณจะใช้งานได้ฟรี แต่โปรดจำไว้ว่าการเผยแพร่โค้ดซ้ำจะต้องเป็นไปตาม กฎระเบียบการใช้งาน ของเรา
คำจำกัดสิทธิ์ความรับผิดชอบ
ข้อมูลและบทความไม่ได้มีวัตถุประสงค์เพื่อก่อให้เกิดกิจกรรมทางการเงิน, การลงทุน, การซื้อขาย, ข้อเสนอแนะ หรือคำแนะนำประเภทอื่น ๆ ที่ให้หรือรับรองโดย TradingView อ่านเพิ่มเติมใน ข้อกำหนดการใช้งาน