PROTECTED SOURCE SCRIPT
r - g Oscillator | Norm + Sigma-Bands
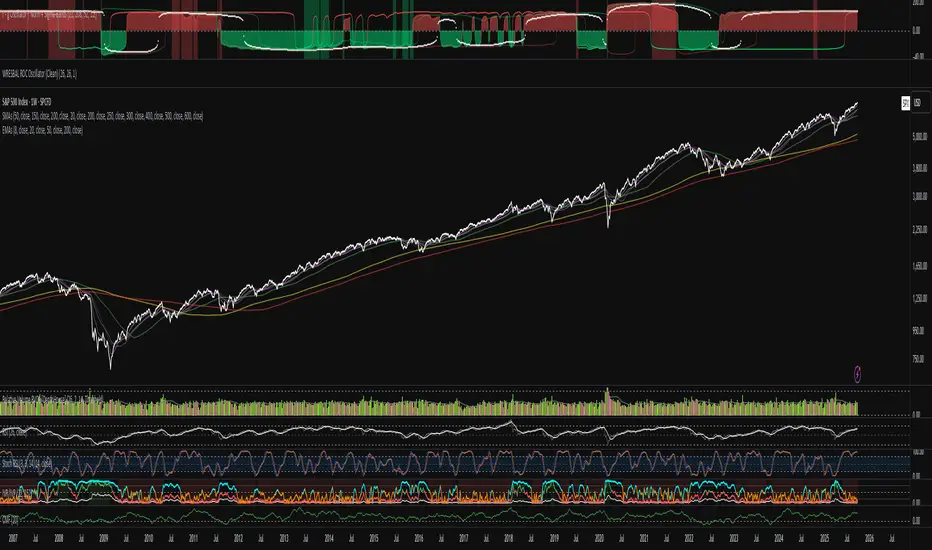
The r–g Oscillator measures the macro-liquidity regime by tracking the gap between real interest rates (r) and nominal GDP growth (g).
It approximates real rate pressure using the 10-Year Treasury yield minus the 5-Year/5-Year forward inflation expectation, and compares that to either Real or Nominal U.S. GDP YoY growth.
Green (g > r): Expansionary backdrop — growth outpaces real yields; liquidity tailwinds.
Red (r > g): Contractionary backdrop — real rates restrictive; liquidity headwinds.
The σ-bands (standard-deviation envelopes) highlight statistically extreme expansions or contractions in the r–g spread.
The “sweet-spot” shading marks moments when r–g breaks strongly above/below zero — early-cycle thrusts or late-cycle stress.
Optional normalization rescales r–g between –1 and +1 to compare across cycles.
Use:
Track shifts in the macro tide rather than short-term waves. Sustained green phases typically align with bull-market environments; red phases often coincide with tightening cycles or recessions. Combine with faster liquidity or breadth measures (e.g., WRESBAL ROC) for tactical confirmation.
สคริปต์ที่ได้รับการป้องกัน
สคริปต์นี้ถูกเผยแพร่เป็นแบบ closed-source อย่างไรก็ตาม คุณสามารถใช้ได้อย่างอิสระและไม่มีข้อจำกัดใดๆ – เรียนรู้เพิ่มเติมได้ที่นี่
คำจำกัดสิทธิ์ความรับผิดชอบ
ข้อมูลและบทความไม่ได้มีวัตถุประสงค์เพื่อก่อให้เกิดกิจกรรมทางการเงิน, การลงทุน, การซื้อขาย, ข้อเสนอแนะ หรือคำแนะนำประเภทอื่น ๆ ที่ให้หรือรับรองโดย TradingView อ่านเพิ่มเติมใน ข้อกำหนดการใช้งาน