PROTECTED SOURCE SCRIPT
Ripster Candle Rvol

INDTRODUCTION
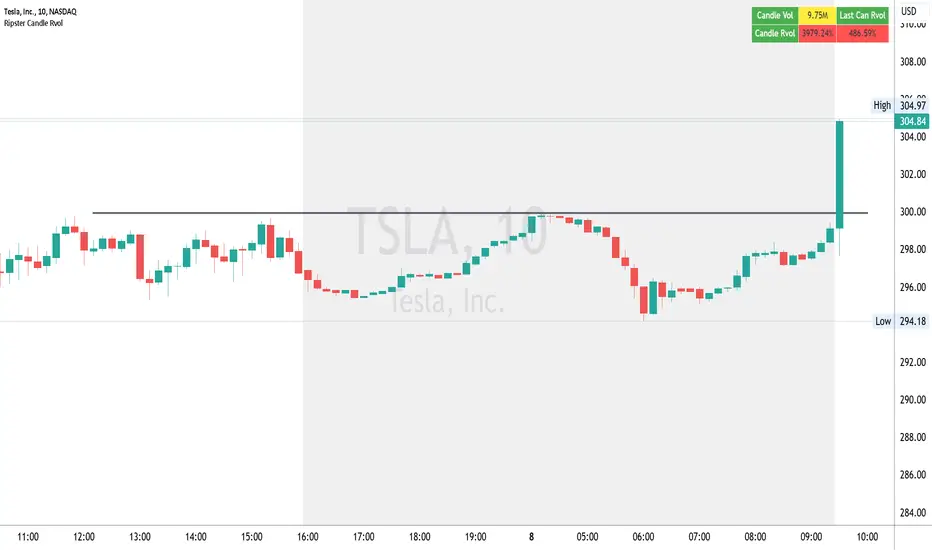
The Ripster Candle Rvol indicator provides traders with a quick and informative view of volume metrics to aid in analyzing high-volume breakouts, reversals, breakdowns, and overall buying or selling pressure.
This creates Labels for Candle Relative Volume. No Such Labels are currently available on Tradingview and I have created these labels to Help traders focussing on Volume Analysis.
This indicator displays three key pieces of information in a labeled table at the top of the chart: total volume of the current candle, Rvol (Relative Volume) of the current candle, and Rvol of the last candle. The Rvol calculation is based on the average volume of the last 50 candles, but this setting can be adjusted to any number of candles as needed, making it suitable for both intraday and multi-timeframe trading.Rvol compares a stock's current trading volume to its average trading volume over a set period of time
Key Features
Real-time Rvol Calculations: The indicator computes Rvol as a percentage of the average volume over a customizable number of candles (defaulting to 50), helping traders determine whether current volume is above, near, or below the recent average.
Volume Metrics Display: The table provides:
Color-coded Visual Cues for Volume Levels: The indicator uses color coding to signal different levels of Rvol, making it easy to identify volume surges:
Red for Rvol over 200%, indicating a strong volume spike and significant trading interest.
Orange for Rvol between 100% and 200%, signaling moderately high volume.
Yellow for Rvol below 100%, indicating volume near or below the recent average.
Usage
Volume-Based Trading Decisions: The Ripster Candle Rvol indicator is ideal for identifying high-volume breakouts, breakdowns, and reversals by providing insights into unusual trading activity.
Assessing Buying and Selling Pressure: High Rvol values indicate strong buying or selling interest, which is particularly useful for assessing momentum in intraday or multi-candle setups.
Volume Trend Analysis: The inclusion of the previous candle’s Rvol helps traders observe shifts in volume trends, signaling potential changes in market momentum.
Settings
Customizable Candle Average: Rvol is calculated against the average volume of the past 50 candles by default, but this can be adjusted to any number, allowing for flexible analysis based on preferred trading strategies and timeframes.
Customizable Table Position: The table is displayed at the top of the chart by default, but users can adjust its position (e.g., top-right, bottom-left) for optimal chart visibility.
The Ripster Candle Rvol indicator is an effective tool for traders who rely on volume analysis to identify market momentum, potential breakouts, and trend shifts by monitoring current and historical relative volume levels. This can be used by Day Traders, Swing Traders & Investors
The Ripster Candle Rvol indicator provides traders with a quick and informative view of volume metrics to aid in analyzing high-volume breakouts, reversals, breakdowns, and overall buying or selling pressure.
This creates Labels for Candle Relative Volume. No Such Labels are currently available on Tradingview and I have created these labels to Help traders focussing on Volume Analysis.
This indicator displays three key pieces of information in a labeled table at the top of the chart: total volume of the current candle, Rvol (Relative Volume) of the current candle, and Rvol of the last candle. The Rvol calculation is based on the average volume of the last 50 candles, but this setting can be adjusted to any number of candles as needed, making it suitable for both intraday and multi-timeframe trading.Rvol compares a stock's current trading volume to its average trading volume over a set period of time
Key Features
Real-time Rvol Calculations: The indicator computes Rvol as a percentage of the average volume over a customizable number of candles (defaulting to 50), helping traders determine whether current volume is above, near, or below the recent average.
Volume Metrics Display: The table provides:
- Candle Volume: Displays the total volume of the current candle.
- Current Candle Rvol: Shows the Rvol percentage for the current candle, highlighting unusual volume levels.
- Previous Candle Rvol: Displays the Rvol of the previous candle, helping traders track volume trends.
Color-coded Visual Cues for Volume Levels: The indicator uses color coding to signal different levels of Rvol, making it easy to identify volume surges:
Red for Rvol over 200%, indicating a strong volume spike and significant trading interest.
Orange for Rvol between 100% and 200%, signaling moderately high volume.
Yellow for Rvol below 100%, indicating volume near or below the recent average.
Usage
Volume-Based Trading Decisions: The Ripster Candle Rvol indicator is ideal for identifying high-volume breakouts, breakdowns, and reversals by providing insights into unusual trading activity.
Assessing Buying and Selling Pressure: High Rvol values indicate strong buying or selling interest, which is particularly useful for assessing momentum in intraday or multi-candle setups.
Volume Trend Analysis: The inclusion of the previous candle’s Rvol helps traders observe shifts in volume trends, signaling potential changes in market momentum.
Settings
Customizable Candle Average: Rvol is calculated against the average volume of the past 50 candles by default, but this can be adjusted to any number, allowing for flexible analysis based on preferred trading strategies and timeframes.
Customizable Table Position: The table is displayed at the top of the chart by default, but users can adjust its position (e.g., top-right, bottom-left) for optimal chart visibility.
The Ripster Candle Rvol indicator is an effective tool for traders who rely on volume analysis to identify market momentum, potential breakouts, and trend shifts by monitoring current and historical relative volume levels. This can be used by Day Traders, Swing Traders & Investors
สคริปต์ที่ได้รับการป้องกัน
สคริปต์นี้ถูกเผยแพร่เป็นแบบ closed-source อย่างไรก็ตาม คุณสามารถใช้ได้อย่างอิสระและไม่มีข้อจำกัดใดๆ – เรียนรู้เพิ่มเติมได้ที่นี่
คำจำกัดสิทธิ์ความรับผิดชอบ
ข้อมูลและบทความไม่ได้มีวัตถุประสงค์เพื่อก่อให้เกิดกิจกรรมทางการเงิน, การลงทุน, การซื้อขาย, ข้อเสนอแนะ หรือคำแนะนำประเภทอื่น ๆ ที่ให้หรือรับรองโดย TradingView อ่านเพิ่มเติมใน ข้อกำหนดการใช้งาน