OPEN-SOURCE SCRIPT
ที่อัปเดต: 7 Week Rule

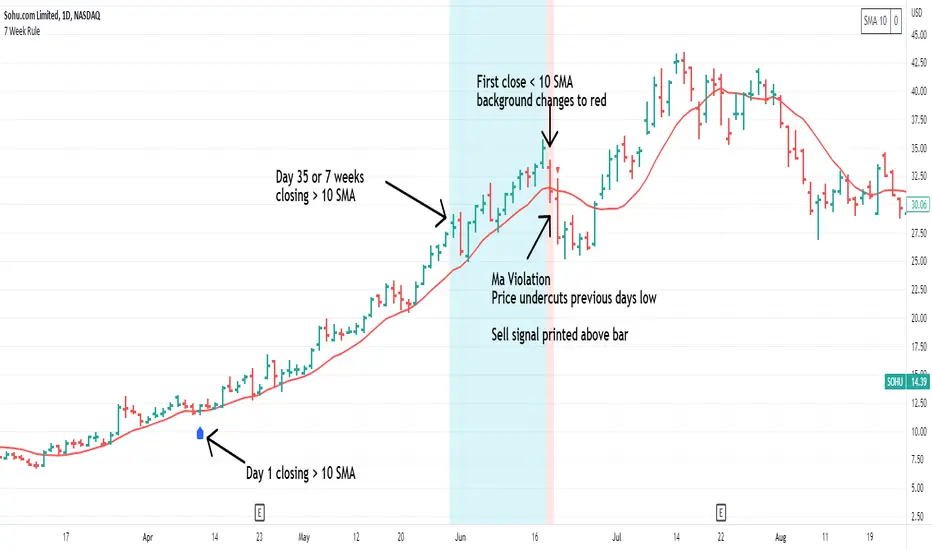
The 7 week rule was shared by Gil Morales in his book “Trade Like an O’Neil Disciple”. The rule is described as: Stocks that have shown a tendency to “obey” or “respect” the 10-day moving average for at least 7 weeks in an uptrend should often be sold once the stock violates the 10-day line. A “violation” is defined as a close below the 10-day moving average followed by a move on the next day below the intraday low of the first day.
This indicator makes using the 7 week rule easy. Once a stock has closed above its selected moving average (10SMA by default) for 35 days the 7 week rule is triggered. Once the stock then “violates” the moving average, a sell signal is printed on the chart.
Indicator Customizations
Indicator is dynamic and will continue the count if no violation occurs.

This indicator makes using the 7 week rule easy. Once a stock has closed above its selected moving average (10SMA by default) for 35 days the 7 week rule is triggered. Once the stock then “violates” the moving average, a sell signal is printed on the chart.
Indicator Customizations
- Moving Average Length & Type
- Show or Hide Moving Average
- Show Running Count of Days Above Selected MA
- Highlight When 7 Week Rule Triggers
- Option to Show First Day Above MA
Indicator is dynamic and will continue the count if no violation occurs.
เอกสารเผยแพร่
Small change to day 1 label placementสคริปต์โอเพนซอร์ซ
ด้วยเจตนารมณ์หลักของ TradingView ผู้สร้างสคริปต์นี้ได้ทำให้เป็นโอเพนซอร์ส เพื่อให้เทรดเดอร์สามารถตรวจสอบและยืนยันฟังก์ชันการทำงานของมันได้ ขอชื่นชมผู้เขียน! แม้ว่าคุณจะใช้งานได้ฟรี แต่โปรดจำไว้ว่าการเผยแพร่โค้ดซ้ำจะต้องเป็นไปตาม กฎระเบียบการใช้งาน ของเรา
Trusted Pine programmer. Send me a message for script development.
คำจำกัดสิทธิ์ความรับผิดชอบ
ข้อมูลและบทความไม่ได้มีวัตถุประสงค์เพื่อก่อให้เกิดกิจกรรมทางการเงิน, การลงทุน, การซื้อขาย, ข้อเสนอแนะ หรือคำแนะนำประเภทอื่น ๆ ที่ให้หรือรับรองโดย TradingView อ่านเพิ่มเติมใน ข้อกำหนดการใช้งาน
สคริปต์โอเพนซอร์ซ
ด้วยเจตนารมณ์หลักของ TradingView ผู้สร้างสคริปต์นี้ได้ทำให้เป็นโอเพนซอร์ส เพื่อให้เทรดเดอร์สามารถตรวจสอบและยืนยันฟังก์ชันการทำงานของมันได้ ขอชื่นชมผู้เขียน! แม้ว่าคุณจะใช้งานได้ฟรี แต่โปรดจำไว้ว่าการเผยแพร่โค้ดซ้ำจะต้องเป็นไปตาม กฎระเบียบการใช้งาน ของเรา
Trusted Pine programmer. Send me a message for script development.
คำจำกัดสิทธิ์ความรับผิดชอบ
ข้อมูลและบทความไม่ได้มีวัตถุประสงค์เพื่อก่อให้เกิดกิจกรรมทางการเงิน, การลงทุน, การซื้อขาย, ข้อเสนอแนะ หรือคำแนะนำประเภทอื่น ๆ ที่ให้หรือรับรองโดย TradingView อ่านเพิ่มเติมใน ข้อกำหนดการใช้งาน