PROTECTED SOURCE SCRIPT
target price with DCF method by N' TEEREX Hoonjongpang
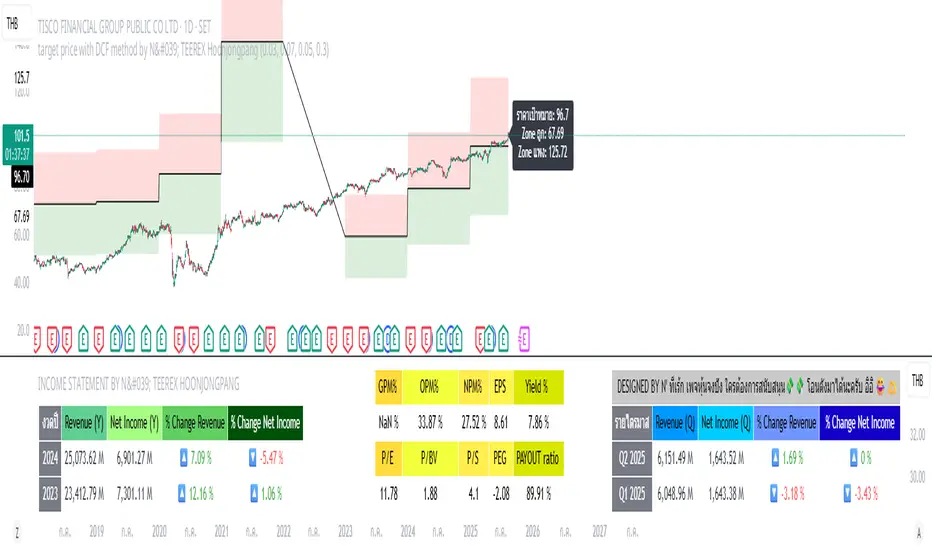
This indicator calculates a stock’s intrinsic value using the latest fiscal year data: free cash flow, debt, equity, shares outstanding, and taxes.
It computes the Weighted Average Cost of Capital (WACC), applies the Gordon Growth formula, and derives a price per share.
A margin of safety is applied to define zones on the chart:
Green Zone: Safe (undervalued)
Red Zone: Not Safe (overvalued)
All key numbers, including WACC, price target, and zones, are displayed as a label.
Result: A visual and numeric guide to the stock’s fair value, helping investors quickly see if the current price is above or below estimated intrinsic value.
สคริปต์ที่ได้รับการป้องกัน
สคริปต์นี้ถูกเผยแพร่เป็นแบบ closed-source อย่างไรก็ตาม คุณสามารถใช้ได้อย่างอิสระและไม่มีข้อจำกัดใดๆ – เรียนรู้เพิ่มเติมได้ที่นี่
คำจำกัดสิทธิ์ความรับผิดชอบ
ข้อมูลและบทความไม่ได้มีวัตถุประสงค์เพื่อก่อให้เกิดกิจกรรมทางการเงิน, การลงทุน, การซื้อขาย, ข้อเสนอแนะ หรือคำแนะนำประเภทอื่น ๆ ที่ให้หรือรับรองโดย TradingView อ่านเพิ่มเติมใน ข้อกำหนดการใช้งาน