OPEN-SOURCE SCRIPT
Fundamentals Panel
Fundamentals Panel Description
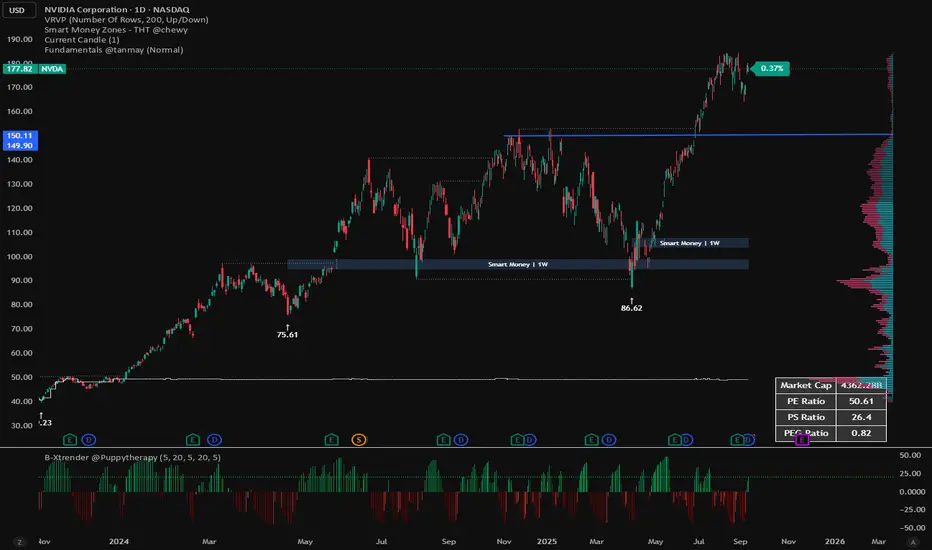
The Fundamentals Panel is a versatile Pine Script indicator that displays key financial metrics—Market Cap, P/E Ratio, P/S Ratio, and PEG Ratio—in a clean, customizable table on your TradingView chart. Designed for investors and traders, this tool brings essential company fundamentals directly to your chart, saving time and enhancing decision-making.
Quick Insights: View critical valuation metrics (Market Cap, P/E, P/S, PEG) at a glance without leaving your chart, ideal for fundamental analysis or screening stocks.
Customizable Display: Toggle each metric on or off via input settings to focus on what matters most to your strategy.
Adjustable Font Size: Choose from Small, Normal, or Large text sizes to ensure readability suits your chart setup and screen preferences.
Reliable Data: Pulls data directly from TradingView’s financial database, using diluted shares and trailing metrics for accuracy across most stocks.
Debugging Support: Includes hidden plots (visible in the Data Window) to verify raw data like shares outstanding, revenue, and PEG, helping you trust the numbers.
How It Works
The indicator fetches:
Market Cap: Calculated using diluted shares outstanding and current price.
P/E Ratio: Price divided by trailing twelve-month (TTM) diluted EPS.
P/S Ratio: Market cap divided by TTM total revenue.
PEG Ratio: Trailing PEG from TradingView’s data, with an additional calculated PEG for cross-checking.
สคริปต์โอเพนซอร์ซ
ด้วยเจตนารมณ์หลักของ TradingView ผู้สร้างสคริปต์นี้ได้ทำให้เป็นโอเพนซอร์ส เพื่อให้เทรดเดอร์สามารถตรวจสอบและยืนยันฟังก์ชันการทำงานของมันได้ ขอชื่นชมผู้เขียน! แม้ว่าคุณจะใช้งานได้ฟรี แต่โปรดจำไว้ว่าการเผยแพร่โค้ดซ้ำจะต้องเป็นไปตาม กฎระเบียบการใช้งาน ของเรา
คำจำกัดสิทธิ์ความรับผิดชอบ
ข้อมูลและบทความไม่ได้มีวัตถุประสงค์เพื่อก่อให้เกิดกิจกรรมทางการเงิน, การลงทุน, การซื้อขาย, ข้อเสนอแนะ หรือคำแนะนำประเภทอื่น ๆ ที่ให้หรือรับรองโดย TradingView อ่านเพิ่มเติมใน ข้อกำหนดการใช้งาน