OPEN-SOURCE SCRIPT
ที่อัปเดต: Top Cap ADD%
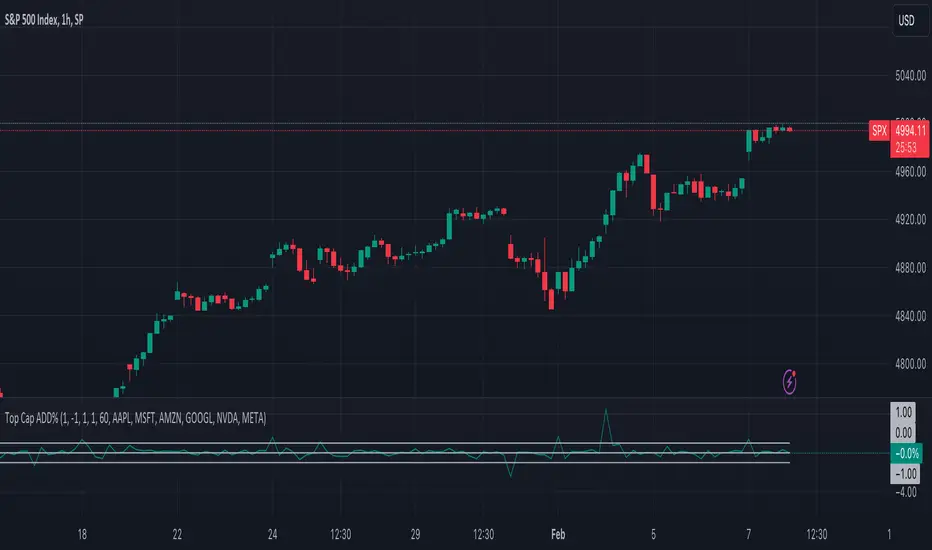
This is a very basic oscillator that plots the average % change of the top 5 highest market cap stocks in the S&P500. It can be easily modified to suit your needs on which stocks you'd like to track, and or filter out the threshold you're looking for.
เอกสารเผยแพร่
This is a very basic oscillator that plots the average % change of the top 6 highest market cap stocks in the S&P500. It can be easily modified to suit your needs on which stocks you'd like to track, and or filter out the threshold you're looking for.The v2 update includes the following changes:
- Fixed a timeframe oversight, the original script forces you to the daily timeframe, you can now select the timeframe you want, this is brings much more versatility to both short term and long term traders.
- The limits are changed from integers to floats, this fixed oversight allows you to have much more control over the outliers you are looking for.
- I have also added
- Background is slightly more transparent by default for better visuals.
สคริปต์โอเพนซอร์ซ
ด้วยเจตนารมณ์หลักของ TradingView ผู้สร้างสคริปต์นี้ได้ทำให้เป็นโอเพนซอร์ส เพื่อให้เทรดเดอร์สามารถตรวจสอบและยืนยันฟังก์ชันการทำงานของมันได้ ขอชื่นชมผู้เขียน! แม้ว่าคุณจะใช้งานได้ฟรี แต่โปรดจำไว้ว่าการเผยแพร่โค้ดซ้ำจะต้องเป็นไปตาม กฎระเบียบการใช้งาน ของเรา
คำจำกัดสิทธิ์ความรับผิดชอบ
ข้อมูลและบทความไม่ได้มีวัตถุประสงค์เพื่อก่อให้เกิดกิจกรรมทางการเงิน, การลงทุน, การซื้อขาย, ข้อเสนอแนะ หรือคำแนะนำประเภทอื่น ๆ ที่ให้หรือรับรองโดย TradingView อ่านเพิ่มเติมใน ข้อกำหนดการใช้งาน