OPEN-SOURCE SCRIPT
OHLC Percent Extension
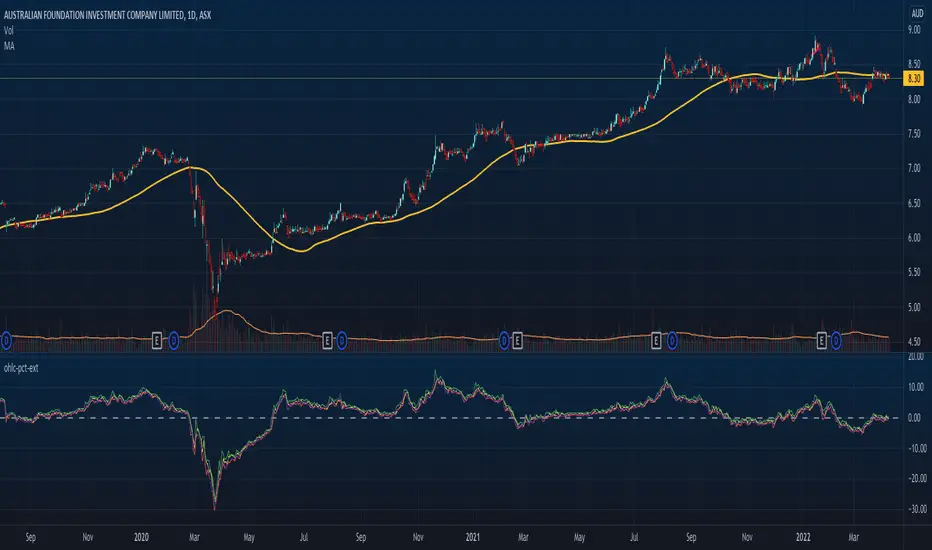
This indicator visually shows OHLC moves in terms of percentages compared to an input reference series, e.g. this could be a moving average line, and then plotting how far OHLC values are from that reference at each time unit/bar.
A centre/zero-line is shown to indicate little to no extension when prices are hovering about there. This could a profit taking point, or an entry point, depending on the system at play.
You may also only be interested in Highs and Lows extension, for example, in which case simply hide the other lines from the indicator settings.
It may factor into trading systems considering both mean reversions, or trend breakouts/breakdowns.
สคริปต์โอเพนซอร์ซ
ด้วยเจตนารมณ์หลักของ TradingView ผู้สร้างสคริปต์นี้ได้ทำให้เป็นโอเพนซอร์ส เพื่อให้เทรดเดอร์สามารถตรวจสอบและยืนยันฟังก์ชันการทำงานของมันได้ ขอชื่นชมผู้เขียน! แม้ว่าคุณจะใช้งานได้ฟรี แต่โปรดจำไว้ว่าการเผยแพร่โค้ดซ้ำจะต้องเป็นไปตาม กฎระเบียบการใช้งาน ของเรา
คำจำกัดสิทธิ์ความรับผิดชอบ
ข้อมูลและบทความไม่ได้มีวัตถุประสงค์เพื่อก่อให้เกิดกิจกรรมทางการเงิน, การลงทุน, การซื้อขาย, ข้อเสนอแนะ หรือคำแนะนำประเภทอื่น ๆ ที่ให้หรือรับรองโดย TradingView อ่านเพิ่มเติมใน ข้อกำหนดการใช้งาน