Bullish/Bearish Phases
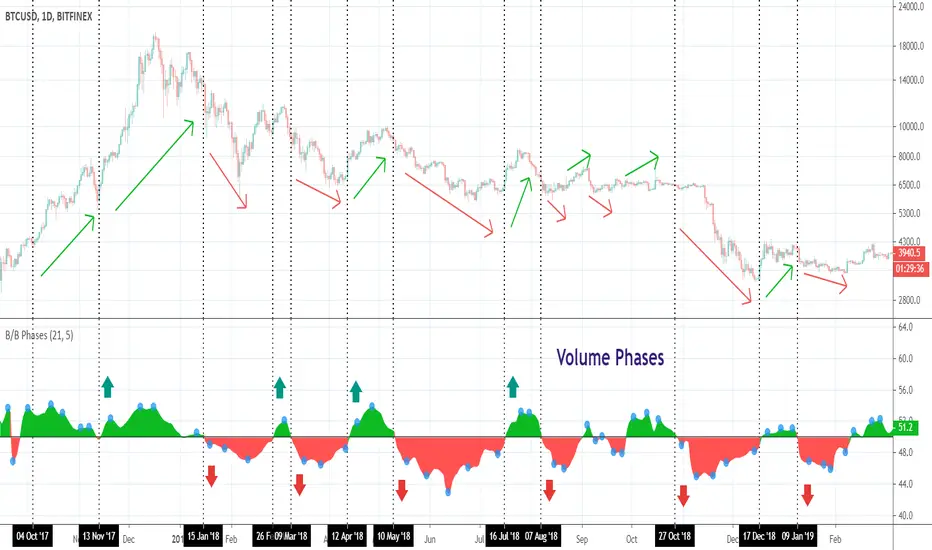
This indicator shows you bullish or bearish dominance during the specified period and is based on the volume calculations. Why? Volume acts as an excellent confirmation tool of the price movements and is used to determine if an instrument is gaining or losing momentum.
Bullish/Bearish Phases can be used to find out divergences with the price. It will work on ANY instrument that has available volume data.
NOTE: The blue circles appear on the local peaks.
I attached some screenshots to show you how it works with other instruments.
Happy Trading!
- Changed styling
- Added smoothing with Jurik Moving Average
- Update
สคริปต์แบบเฉพาะผู้ได้รับเชิญเท่านั้น
เฉพาะผู้ใช้งานที่ผู้เขียนอนุมัตเท่านั้นจึงจะสามารถเข้าถึงสคริปต์นี้ได้ คุณจะต้องขอและได้รับอนุญาตก่อนใช้งาน ซึ่งโดยทั่วไปจะได้รับอนุญาตหลังจากชำระเงินแล้ว สำหรับรายละเอียดเพิ่มเติม โปรดทำตามคำแนะนำของผู้เขียนด้านล่าง หรือติดต่อ everget โดยตรง
TradingView ไม่แนะนำให้จ่ายเงินหรือใช้สคริปต์ เว้นแต่คุณจะเชื่อถือผู้เขียนและเข้าใจวิธีการทำงานของสคริปต์นั้นอย่างถ่องแท้ คุณยังสามารถหาทางเลือกแบบโอเพนซอร์สฟรีได้ใน สคริปต์ชุมชนของเรา
คำแนะนำของผู้เขียน
🆓 List of my FREE indicators: bit.ly/2S7EPuN
💰 List of my PREMIUM indicators: bit.ly/33MA81f
Join Bybit and get up to $6,045 in bonuses!
bybit.com/invite?ref=56ZLQ0Z
คำจำกัดสิทธิ์ความรับผิดชอบ
สคริปต์แบบเฉพาะผู้ได้รับเชิญเท่านั้น
เฉพาะผู้ใช้งานที่ผู้เขียนอนุมัตเท่านั้นจึงจะสามารถเข้าถึงสคริปต์นี้ได้ คุณจะต้องขอและได้รับอนุญาตก่อนใช้งาน ซึ่งโดยทั่วไปจะได้รับอนุญาตหลังจากชำระเงินแล้ว สำหรับรายละเอียดเพิ่มเติม โปรดทำตามคำแนะนำของผู้เขียนด้านล่าง หรือติดต่อ everget โดยตรง
TradingView ไม่แนะนำให้จ่ายเงินหรือใช้สคริปต์ เว้นแต่คุณจะเชื่อถือผู้เขียนและเข้าใจวิธีการทำงานของสคริปต์นั้นอย่างถ่องแท้ คุณยังสามารถหาทางเลือกแบบโอเพนซอร์สฟรีได้ใน สคริปต์ชุมชนของเรา
คำแนะนำของผู้เขียน
🆓 List of my FREE indicators: bit.ly/2S7EPuN
💰 List of my PREMIUM indicators: bit.ly/33MA81f
Join Bybit and get up to $6,045 in bonuses!
bybit.com/invite?ref=56ZLQ0Z