OPEN-SOURCE SCRIPT
KATIK BankNifty Upside/Downside Levels
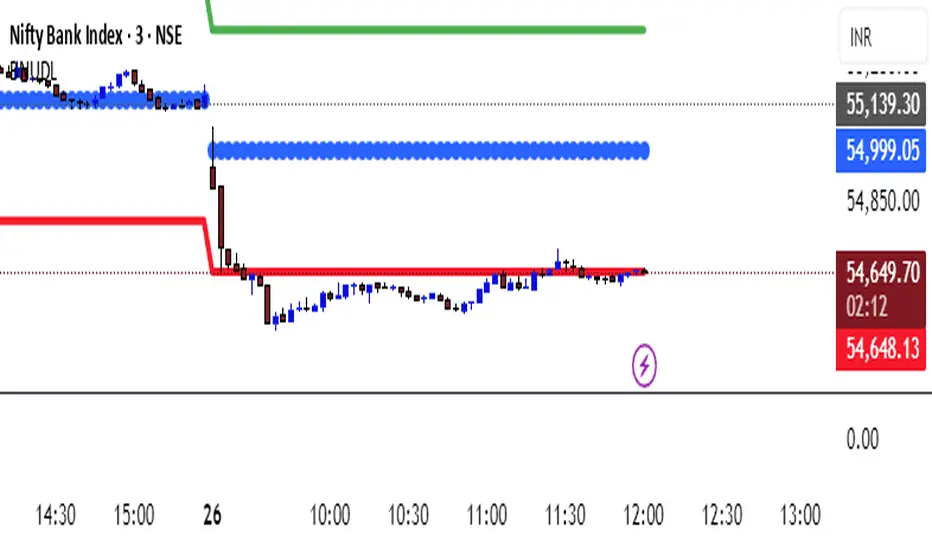
The KATIK BankNifty Upside/Downside Levels (BNUDL) indicator plots key daily reference levels for BankNifty based on its opening price. Using a predefined daily move percentage, it calculates potential upside and downside levels from the open. The script displays:
Up Level (Green): Potential bullish threshold above the open
Down Level (Red): Potential bearish threshold below the open
Open Price (Blue Circles): Daily BankNifty opening level
This tool helps traders quickly identify intraday directional bias and potential support/resistance zones around the opening price.
สคริปต์โอเพนซอร์ซ
ด้วยเจตนารมณ์หลักของ TradingView ผู้สร้างสคริปต์นี้ได้ทำให้เป็นโอเพนซอร์ส เพื่อให้เทรดเดอร์สามารถตรวจสอบและยืนยันฟังก์ชันการทำงานของมันได้ ขอชื่นชมผู้เขียน! แม้ว่าคุณจะใช้งานได้ฟรี แต่โปรดจำไว้ว่าการเผยแพร่โค้ดซ้ำจะต้องเป็นไปตาม กฎระเบียบการใช้งาน ของเรา
คำจำกัดสิทธิ์ความรับผิดชอบ
ข้อมูลและบทความไม่ได้มีวัตถุประสงค์เพื่อก่อให้เกิดกิจกรรมทางการเงิน, การลงทุน, การซื้อขาย, ข้อเสนอแนะ หรือคำแนะนำประเภทอื่น ๆ ที่ให้หรือรับรองโดย TradingView อ่านเพิ่มเติมใน ข้อกำหนดการใช้งาน