OPEN-SOURCE SCRIPT
Circuit % Marker w/ Mirrored Arrows
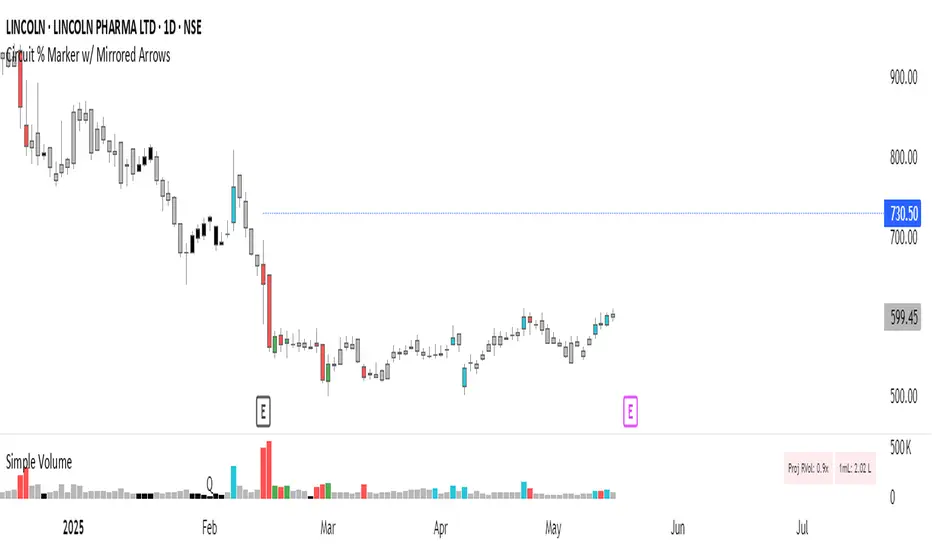
📈 Indian Market Circuit Limit Change Tracker
This indicator automatically tracks circuit limit changes (price bands) as applied in NSE/BSE stocks.
🧠 How It Works:
Start from a user-defined initial circuit limit (e.g. 10%)
If the upper or lower limit is hit, the script waits for a user-defined cooling period (e.g. 5 trading days)
After that, it automatically adjusts to the next lower or higher band (e.g. from 10% to 5%)
Shows a visual label with the current circuit % right on the chart — placed above or below candles for better visibility
🔧 Custom Inputs:
Starting Circuit % — choose between standard NSE/BSE values (20%, 10%, 5%, 2%)
Cooling Days — how many days must pass after a circuit hit before it’s allowed to change again
Label Positioning, Color, and Size — fully customizable to suit your chart style
🚫 No Clutter:
Doesn’t draw circuit limit lines
Just clean, small labels at key turning points — as seen in real trading dashboards
🔍 Notes:
NSE and BSE manually assign circuit bands — this script does not fetch live exchange data
Use it as a visual tracker and simulator of how circuit behavior would evolve under fixed rules
สคริปต์โอเพนซอร์ซ
ด้วยเจตนารมณ์หลักของ TradingView ผู้สร้างสคริปต์นี้ได้ทำให้เป็นโอเพนซอร์ส เพื่อให้เทรดเดอร์สามารถตรวจสอบและยืนยันฟังก์ชันการทำงานของมันได้ ขอชื่นชมผู้เขียน! แม้ว่าคุณจะใช้งานได้ฟรี แต่โปรดจำไว้ว่าการเผยแพร่โค้ดซ้ำจะต้องเป็นไปตาม กฎระเบียบการใช้งาน ของเรา
คำจำกัดสิทธิ์ความรับผิดชอบ
ข้อมูลและบทความไม่ได้มีวัตถุประสงค์เพื่อก่อให้เกิดกิจกรรมทางการเงิน, การลงทุน, การซื้อขาย, ข้อเสนอแนะ หรือคำแนะนำประเภทอื่น ๆ ที่ให้หรือรับรองโดย TradingView อ่านเพิ่มเติมใน ข้อกำหนดการใช้งาน