VuManChu Morpheus
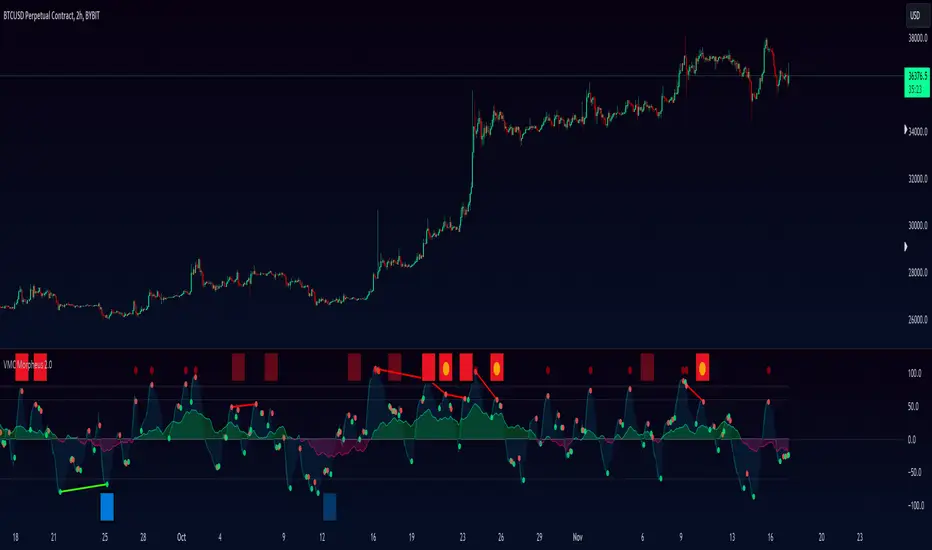
When the oscillator is above the over bought bands (white line at the top) and crosses down the signal (dotted lines), it is usually a good SELL signal. When the oscillator crosses above the signal when below the oversold band (white line at the bottom), it is a good BUY signal.
After forming the larger wave, the “anchor wave” can be used for a secondary confirmation to enter a Sell or a BUY
The yellow and red line in the middle is the dynamic VWAP
Rocket ships are Divergences
Grey rocket ships are hidden divergences
Blood drops are divergences
Grey blood drops are hidden divergences
- Used CryptoBanda's design change and his settings for Stochastic RSI making it way easier to read.
- Made it easier to visualize what's happening on the screen by turning RSI off by default.
- The option to select our brand-new money flow
- The addition of the Golden Sell Dot, previously this indicator only had the Golden Buy Dot only had the buy dot, which in the shortest form would represent trend exhaustion. As an example, if the RSI is below 30 and there is red money flow and a few other conditions then the Gold dot prints with a 2-candle delay.
- Minor changes to the design, such as square icons for the divergences, an increase in size for the Golden Dots so they are not missed and new Money Flow colours.
สคริปต์แบบเฉพาะผู้ได้รับเชิญเท่านั้น
เฉพาะผู้ใช้งานที่ผู้เขียนอนุมัตเท่านั้นจึงจะสามารถเข้าถึงสคริปต์นี้ได้ คุณจะต้องขอและได้รับอนุญาตก่อนใช้งาน ซึ่งโดยทั่วไปจะได้รับอนุญาตหลังจากชำระเงินแล้ว สำหรับรายละเอียดเพิ่มเติม โปรดทำตามคำแนะนำของผู้เขียนด้านล่าง หรือติดต่อ vumanchu โดยตรง
TradingView ไม่แนะนำให้จ่ายเงินหรือใช้สคริปต์ เว้นแต่คุณจะเชื่อถือผู้เขียนและเข้าใจวิธีการทำงานของสคริปต์นั้นอย่างถ่องแท้ คุณยังสามารถหาทางเลือกแบบโอเพนซอร์สฟรีได้ใน สคริปต์ชุมชนของเรา
คำแนะนำของผู้เขียน
คำจำกัดสิทธิ์ความรับผิดชอบ
สคริปต์แบบเฉพาะผู้ได้รับเชิญเท่านั้น
เฉพาะผู้ใช้งานที่ผู้เขียนอนุมัตเท่านั้นจึงจะสามารถเข้าถึงสคริปต์นี้ได้ คุณจะต้องขอและได้รับอนุญาตก่อนใช้งาน ซึ่งโดยทั่วไปจะได้รับอนุญาตหลังจากชำระเงินแล้ว สำหรับรายละเอียดเพิ่มเติม โปรดทำตามคำแนะนำของผู้เขียนด้านล่าง หรือติดต่อ vumanchu โดยตรง
TradingView ไม่แนะนำให้จ่ายเงินหรือใช้สคริปต์ เว้นแต่คุณจะเชื่อถือผู้เขียนและเข้าใจวิธีการทำงานของสคริปต์นั้นอย่างถ่องแท้ คุณยังสามารถหาทางเลือกแบบโอเพนซอร์สฟรีได้ใน สคริปต์ชุมชนของเรา