PROTECTED SOURCE SCRIPT
ที่อัปเดต: MTF RSI Grid with MFI [checkm8]
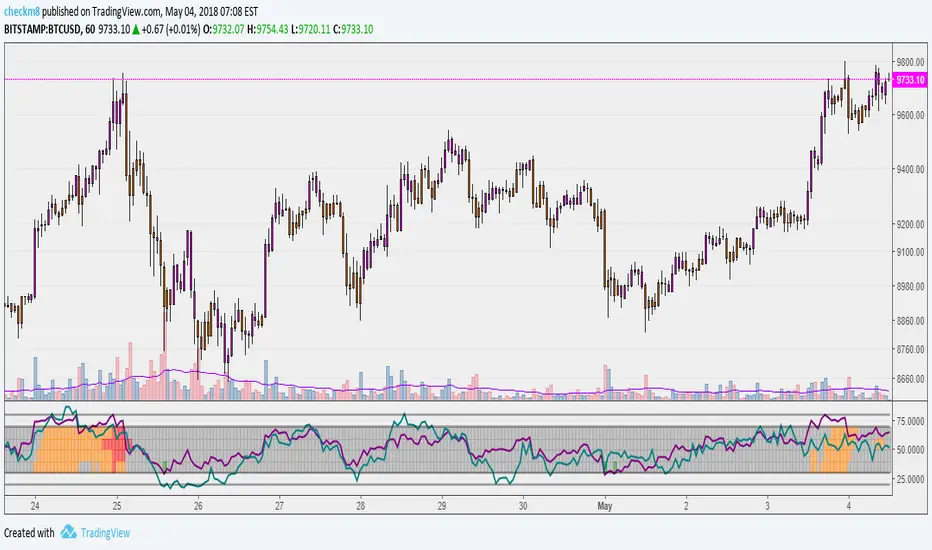
Hello and welcome to my version of the multi-timeframe RSI grid, with MFI.
This oscillator is relatively simple and plots four sets of timeframes (selected by the user) within the levels between 30 and 70. In addition to this, it plots the RSI from the current timeframe, as well as the MFI.
As per the default settings:
1) The grid will show lime-colored blocks when the RSI is below 20 and green blocks when RSI is below 30.
2) The grid will show red-colored blocks when RSI is above 80 and orange blocks when RSI is above 70.
3) The initial MTF setup is set to 1 Hour, 2 Hour, 3 Hour, and 4 Hour timeframes. You can adjust this to your preference in the oscillator settings.
4) The purple line is RSI, the teal line is MFI.
Note: the grid only displays RSI values, not MFI.
Happy trading!
เอกสารเผยแพร่
Fix for MTF grid (re: TradingView columns visual update)สคริปต์ที่ได้รับการป้องกัน
สคริปต์นี้ถูกเผยแพร่เป็นแบบ closed-source อย่างไรก็ตาม คุณสามารถใช้ได้อย่างอิสระและไม่มีข้อจำกัดใดๆ – เรียนรู้เพิ่มเติมได้ที่นี่
คำจำกัดสิทธิ์ความรับผิดชอบ
ข้อมูลและบทความไม่ได้มีวัตถุประสงค์เพื่อก่อให้เกิดกิจกรรมทางการเงิน, การลงทุน, การซื้อขาย, ข้อเสนอแนะ หรือคำแนะนำประเภทอื่น ๆ ที่ให้หรือรับรองโดย TradingView อ่านเพิ่มเติมใน ข้อกำหนดการใช้งาน
สคริปต์ที่ได้รับการป้องกัน
สคริปต์นี้ถูกเผยแพร่เป็นแบบ closed-source อย่างไรก็ตาม คุณสามารถใช้ได้อย่างอิสระและไม่มีข้อจำกัดใดๆ – เรียนรู้เพิ่มเติมได้ที่นี่
คำจำกัดสิทธิ์ความรับผิดชอบ
ข้อมูลและบทความไม่ได้มีวัตถุประสงค์เพื่อก่อให้เกิดกิจกรรมทางการเงิน, การลงทุน, การซื้อขาย, ข้อเสนอแนะ หรือคำแนะนำประเภทอื่น ๆ ที่ให้หรือรับรองโดย TradingView อ่านเพิ่มเติมใน ข้อกำหนดการใช้งาน