PROTECTED SOURCE SCRIPT
ที่อัปเดต: Distribution Quarter Indicator
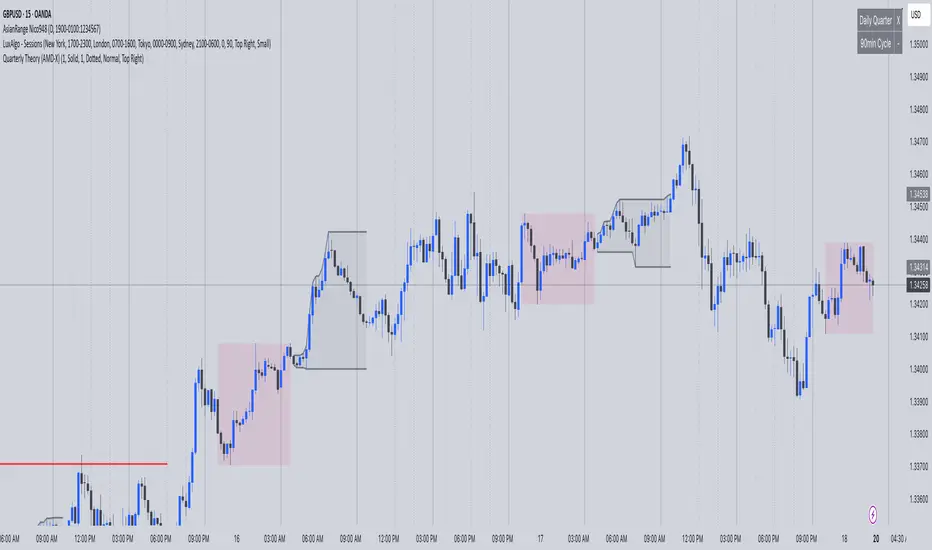
This indicator automatically draws vertical lines at the two most important distribution quarter times in the trading day:
6:00 AM NY time (Market preparation phase)
12:00 PM NY time (Midday distribution period)
Key Features:
✅ 15-minute timeframe only - Designed specifically for intraday distribution analysis
✅ Automatic time detection - Uses NY timezone (UTC-4) for accurate timing
✅ Fully customizable lines - Choose between solid, dotted, or dashed styles
✅ Adjustable line width - Set thickness from 1-5 pixels
✅ Custom colors - Individual color settings for each time marker
✅ Optional labels - Toggle time labels on/off
✅ Historical coverage - Lines appear on all past and future data
Perfect For:
Day traders tracking distribution patterns
Scalpers identifying key time-based levels
Anyone analyzing intraday market structure around quarter periods
How to Use:
Apply to any 15-minute chart
Customize line styles and colors in settings
Lines will automatically appear at the specified NY times
Use as reference points for distribution analysis
Note: Indicator only functions on 15-minute timeframes and includes a helpful reminder if used on other timeframes.
เอกสารเผยแพร่
Distribution Quarter IndicatorMark key distribution times with vertical lines at 6:00 AM and 12:00 PM NY time
Features:
Flexible timeframes - Choose 1m, 5m, 15m, 30m, 1H, 4H (15m default)
Future lines - Shows next upcoming quarter times
Customizable - Line style, width, colors, labels
Historical data - Lines on all past candles
Perfect for:
Day traders tracking distribution patterns
Planning entries around key NY session times
Market structure analysis
Setup:
Select timeframes with checkboxes
Customize line appearance in settings
Lines automatically appear at 6:00 AM and 12:00 PM NY time
Simple, clean, and effective for distribution quarter analysis.
เอกสารเผยแพร่
V2สคริปต์ที่ได้รับการป้องกัน
สคริปต์นี้ถูกเผยแพร่เป็นแบบ closed-source อย่างไรก็ตาม คุณสามารถใช้ได้อย่างอิสระและไม่มีข้อจำกัดใดๆ – เรียนรู้เพิ่มเติมได้ที่นี่
คำจำกัดสิทธิ์ความรับผิดชอบ
ข้อมูลและบทความไม่ได้มีวัตถุประสงค์เพื่อก่อให้เกิดกิจกรรมทางการเงิน, การลงทุน, การซื้อขาย, ข้อเสนอแนะ หรือคำแนะนำประเภทอื่น ๆ ที่ให้หรือรับรองโดย TradingView อ่านเพิ่มเติมใน ข้อกำหนดการใช้งาน
สคริปต์ที่ได้รับการป้องกัน
สคริปต์นี้ถูกเผยแพร่เป็นแบบ closed-source อย่างไรก็ตาม คุณสามารถใช้ได้อย่างอิสระและไม่มีข้อจำกัดใดๆ – เรียนรู้เพิ่มเติมได้ที่นี่
คำจำกัดสิทธิ์ความรับผิดชอบ
ข้อมูลและบทความไม่ได้มีวัตถุประสงค์เพื่อก่อให้เกิดกิจกรรมทางการเงิน, การลงทุน, การซื้อขาย, ข้อเสนอแนะ หรือคำแนะนำประเภทอื่น ๆ ที่ให้หรือรับรองโดย TradingView อ่านเพิ่มเติมใน ข้อกำหนดการใช้งาน