INVITE-ONLY SCRIPT
SB Master Chart v4
ที่อัปเดต:
This is the follow up to SB Master Chart. This is a subscription only indicator.
SB Master Chart was designed with a minimalist appearance, but is able to provide a trader with all the information he needs at a glance to make informed trading decisions. This chart utilizes the alert() function so the trader can be alerted even while away from a computer to a potential trade opportunity.
Version 4 has been redesigned for maximal efficiency. Over the many iterations of the script, I introduced many new visual affects which detracted from the simplicity of the original script. I have since removed many of the eye candy and kept the fundamental visuals that made the script eye appealing. I have redesigned the back end code of the script to be more efficient with the use of custom functions. From V1 to V2 I introduced a trend filter. This made V2 a multi-time frame script. I have since removed the trend filter because it was filtering out many viable trades on shorter time periods. Despite removing the trend filter, I have kept the multi time period functionality of the script and introduced alerting on multiple time periods with one alert.
This chart incorporates the following indicators in some form
The chart utilizes a combination of 5 indicators to determine overbought and oversold levels.
The green dot indicates oversold conditions. (alerted)
The red dot indicates overbought conditions. (alerted)
The orange dots sometimes precede the green and red dots and are determined by opportunistic volume and often provide better enter and exit opportunities and green and red dots. (alerted)
The yellow dots always precede the green and red dots.
The bar colors are determined by the three moving averages the chart tracks, MA5 , MA20, and MA50.
If the bars are green, a clear uptrend is happening, red represents downtrend.
Yellow bars indicate MA5 is in an uptrend and Orange indicates that MA5 is in a downtrend.
The VWAP lines are based on the following periods and serve as support and resistance lines.
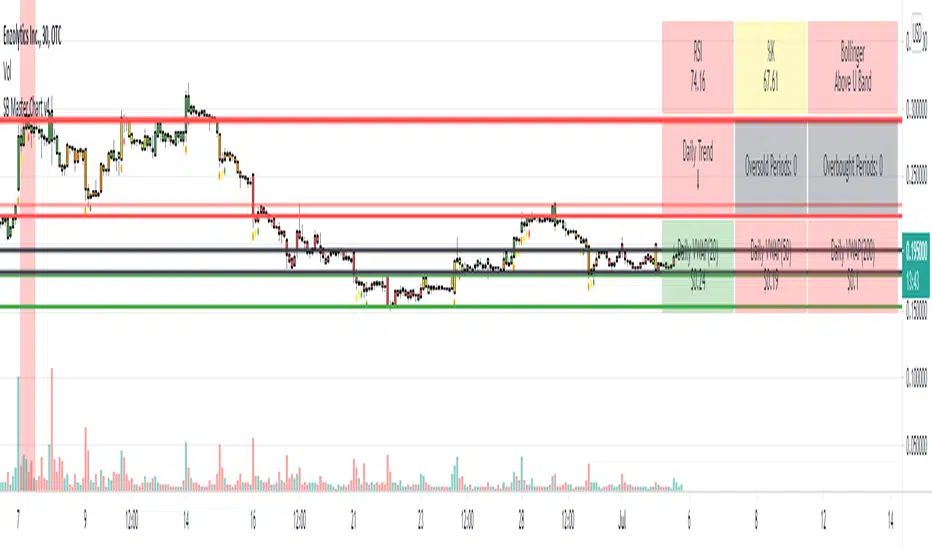
The black horizontal lines represent the upper and lower Bollinger bands and serve as elastic support and resistance lines.
The green background represents oversold on 4+ time periods. (alerted)
The red background represents overbought on 4+ time periods. (alerted)
I have also implemented a 4 column table at the top for key indicators: RSI, Stochastic %K, Bollinger, and Daily Trend.
This script utilizes several alert() conditions of various frequency. It utilizes both the alert.freq_once_per_bar_close and alert.freq_once_per_bar options to achieve more timely alerts.
*Special Note - Set alerts on the 30m chart for best results, this will allow regular alerts for all time periods every 30 minutes throughout the trading day.
Some alerts do not require bar close and should be taken more seriously as the alert is more time sensitive.
SB Master Chart was designed with a minimalist appearance, but is able to provide a trader with all the information he needs at a glance to make informed trading decisions. This chart utilizes the alert() function so the trader can be alerted even while away from a computer to a potential trade opportunity.
Version 4 has been redesigned for maximal efficiency. Over the many iterations of the script, I introduced many new visual affects which detracted from the simplicity of the original script. I have since removed many of the eye candy and kept the fundamental visuals that made the script eye appealing. I have redesigned the back end code of the script to be more efficient with the use of custom functions. From V1 to V2 I introduced a trend filter. This made V2 a multi-time frame script. I have since removed the trend filter because it was filtering out many viable trades on shorter time periods. Despite removing the trend filter, I have kept the multi time period functionality of the script and introduced alerting on multiple time periods with one alert.
This chart incorporates the following indicators in some form
- Bolinger
- MACD
- RSI
- Stochastik
- VWAP
- Moving Averages
- Volume
The chart utilizes a combination of 5 indicators to determine overbought and oversold levels.
The green dot indicates oversold conditions. (alerted)
The red dot indicates overbought conditions. (alerted)
The orange dots sometimes precede the green and red dots and are determined by opportunistic volume and often provide better enter and exit opportunities and green and red dots. (alerted)
The yellow dots always precede the green and red dots.
The bar colors are determined by the three moving averages the chart tracks, MA5 , MA20, and MA50.
If the bars are green, a clear uptrend is happening, red represents downtrend.
Yellow bars indicate MA5 is in an uptrend and Orange indicates that MA5 is in a downtrend.
The VWAP lines are based on the following periods and serve as support and resistance lines.
- Green (20 Period)
- Yellow (50 Period)
- Red (100 Period)
The black horizontal lines represent the upper and lower Bollinger bands and serve as elastic support and resistance lines.
The green background represents oversold on 4+ time periods. (alerted)
The red background represents overbought on 4+ time periods. (alerted)
I have also implemented a 4 column table at the top for key indicators: RSI, Stochastic %K, Bollinger, and Daily Trend.
This script utilizes several alert() conditions of various frequency. It utilizes both the alert.freq_once_per_bar_close and alert.freq_once_per_bar options to achieve more timely alerts.
*Special Note - Set alerts on the 30m chart for best results, this will allow regular alerts for all time periods every 30 minutes throughout the trading day.
Some alerts do not require bar close and should be taken more seriously as the alert is more time sensitive.
เอกสารเผยแพร่
Updated table to display how many oversold/overbought periods a chart has.เอกสารเผยแพร่
Consolidated the alerts mechanism. This version will now display the number of oversold/overbought periods and which periods in one alert. Also updated the tables to show which periods are oversold.เอกสารเผยแพร่
Removed inputs. Chart will automatically alert on 30m, 1h, 2h, 4h and 1d.เอกสารเผยแพร่
Fixed a bug with the orange dot overbought/oversold alert.เอกสารเผยแพร่
Update chart table image on script.เอกสารเผยแพร่
More updates to the alerts feature.เอกสารเผยแพร่
Updated table to include daily vwap for determining a price target when making a trade. Also swapped out 100 period vwap support line for a 200 period vwap line.เอกสารเผยแพร่
Updated the way high volume alerts occur. It was alerting on too many time frames, I have combined all the time frames into one alert.เอกสารเผยแพร่
Minor changes to volume alerts, added more conditions. The end goal is to receive less alerts, more actionable alerts.เอกสารเผยแพร่
Fixed alert bug.เอกสารเผยแพร่
More alert bug fixesเอกสารเผยแพร่
Updated Visuals, added support and resistance lines. Support lines based on 30m, 1h, and 2h charts. Best used on a 30m chart.Added options to disable support lines and vwap lines.
No algo changes made in this update, its strictly visual updates to help trader make more informed decisions.
เอกสารเผยแพร่
Made vwap lines default for support lines. You can change the settings in the options if you prefer support lines determined by RSI + Volume and/or both.สคริปต์เฉพาะผู้ได้รับเชิญเท่านั้น
การเข้าถึงสคริปต์นี้จำกัดเฉพาะผู้ใช้ที่ได้รับอนุญาตจากผู้เขียน และมักจะต้องชำระเงินก่อน คุณสามารถเพิ่มลงในรายการโปรดของคุณได้ แต่คุณจะสามารถใช้งานได้หลังจากขออนุญาตและขอรับจากผู้เขียนเท่านั้น ติดต่อ StuBuzzzini สำหรับข้อมูลเพิ่มเติม หรือทำตามคำแนะนำของผู้เขียนด้านล่าง
TradingView ไม่แนะนำให้ชำระเงินสำหรับการซื้อสคริปต์และไม่แนะนำให้ใช้งานสคริปต์นั้นๆ จนกว่าคุณจะเชื่อมั่นในผู้เขียนสคริปต์ 100% และเข้าใจว่าสคริปต์ทำงานอย่างไร ในกรณีอื่นๆ คุณสามารถหาทางเลือกโอเพนซอร์สที่ดีได้ฟรีใน สคริปต์ชุมชน ของเรา
คำแนะนำของผู้เขียน
″You can sign up for a free 14 day trial at my website: https://sbmasterchart.com/14-day-free-trial/ If you wish to subscribe, patreon tiers are limited. https://sbmasterchart.com/patreon
ต้องการที่จะใช้สคริปต์นี้บนชาร์ตใช่ไหม?
คำเตือน: กรุณาอ่าน ก่อนร้องขอการเข้าถึง
คำจำกัดสิทธิ์ความรับผิดชอบ
ข้อมูลและบทความไม่ได้มีวัตถุประสงค์เพื่อก่อให้เกิดกิจกรรมทางการเงิน, การลงทุน, การซื้อขาย, ข้อเสนอแนะ หรือคำแนะนำประเภทอื่น ๆ ที่ให้หรือรับรองโดย TradingView อ่านเพิ่มเติมที่ เงื่อนไขการใช้บริการ