OPEN-SOURCE SCRIPT
ที่อัปเดต: Z Score
What Is Z-Score?
Z-score is a statistical measurement that describes a value's relationship to the mean of a group of values. Z-score is measured in terms of standard deviations from the mean. If a Z-score is 0, it indicates that the data point's score is identical to the mean score. A Z-score of 1.0 would indicate a value that is one standard deviation from the mean. Z-scores may be positive or negative, with a positive value indicating the score is above the mean and a negative score indicating it is below the mean.
CBOE Volatility Index
VIX is the ticker symbol and the popular name for the Chicago Board Options Exchange's CBOE Volatility Index, a popular measure of the stock market's expectation of volatility based on S&P 500 index options. It is calculated and disseminated on a real-time basis by the CBOE, and is often referred to as the fear index or fear gauge. To summarize, VIX is a volatility index derived from S&P 500 options for the 30 days following the measurement date, with the price of each option representing the market's expectation of 30-day forward-looking volatility. The resulting VIX index formulation provides a measure of expected market volatility on which expectations of further stock market volatility in the near future might be based
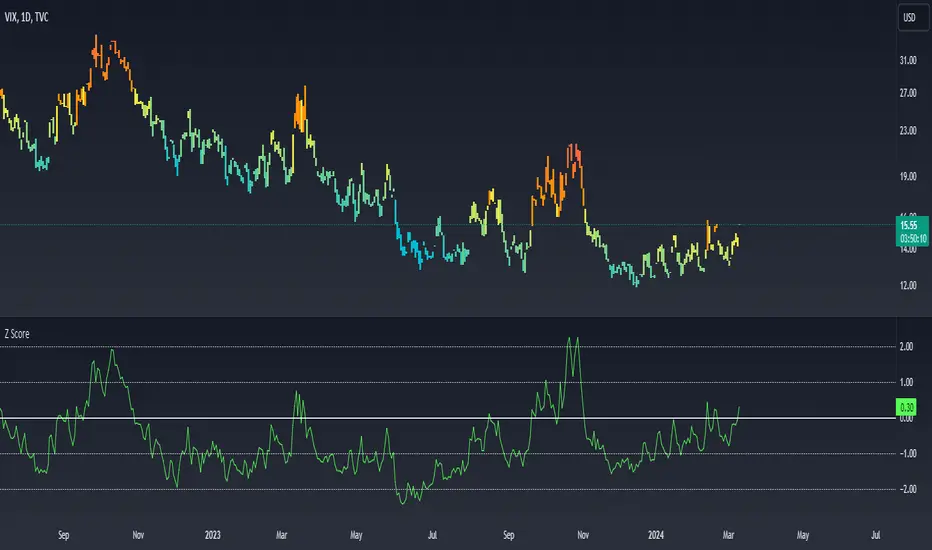
Z Scores of VIX
When the Z-scored VIX indicator exceeds the +2 standard deviation mark, the system forecasts mean reversion and decreasing volatility and the possibility of an upward trend in S&P500.
When the Z-scored VIX indicator falls below -2 standard deviations, the system predicts future increasing volatility and the possibility of a downward trend in S&P500.
Z-score is a statistical measurement that describes a value's relationship to the mean of a group of values. Z-score is measured in terms of standard deviations from the mean. If a Z-score is 0, it indicates that the data point's score is identical to the mean score. A Z-score of 1.0 would indicate a value that is one standard deviation from the mean. Z-scores may be positive or negative, with a positive value indicating the score is above the mean and a negative score indicating it is below the mean.
CBOE Volatility Index
VIX is the ticker symbol and the popular name for the Chicago Board Options Exchange's CBOE Volatility Index, a popular measure of the stock market's expectation of volatility based on S&P 500 index options. It is calculated and disseminated on a real-time basis by the CBOE, and is often referred to as the fear index or fear gauge. To summarize, VIX is a volatility index derived from S&P 500 options for the 30 days following the measurement date, with the price of each option representing the market's expectation of 30-day forward-looking volatility. The resulting VIX index formulation provides a measure of expected market volatility on which expectations of further stock market volatility in the near future might be based
Z Scores of VIX
When the Z-scored VIX indicator exceeds the +2 standard deviation mark, the system forecasts mean reversion and decreasing volatility and the possibility of an upward trend in S&P500.
When the Z-scored VIX indicator falls below -2 standard deviations, the system predicts future increasing volatility and the possibility of a downward trend in S&P500.
เอกสารเผยแพร่
Heat Mapสคริปต์โอเพนซอร์ซ
ด้วยเจตนารมณ์หลักของ TradingView ผู้สร้างสคริปต์นี้ได้ทำให้เป็นโอเพนซอร์ส เพื่อให้เทรดเดอร์สามารถตรวจสอบและยืนยันฟังก์ชันการทำงานของมันได้ ขอชื่นชมผู้เขียน! แม้ว่าคุณจะใช้งานได้ฟรี แต่โปรดจำไว้ว่าการเผยแพร่โค้ดซ้ำจะต้องเป็นไปตาม กฎระเบียบการใช้งาน ของเรา
คำจำกัดสิทธิ์ความรับผิดชอบ
ข้อมูลและบทความไม่ได้มีวัตถุประสงค์เพื่อก่อให้เกิดกิจกรรมทางการเงิน, การลงทุน, การซื้อขาย, ข้อเสนอแนะ หรือคำแนะนำประเภทอื่น ๆ ที่ให้หรือรับรองโดย TradingView อ่านเพิ่มเติมใน ข้อกำหนดการใช้งาน
สคริปต์โอเพนซอร์ซ
ด้วยเจตนารมณ์หลักของ TradingView ผู้สร้างสคริปต์นี้ได้ทำให้เป็นโอเพนซอร์ส เพื่อให้เทรดเดอร์สามารถตรวจสอบและยืนยันฟังก์ชันการทำงานของมันได้ ขอชื่นชมผู้เขียน! แม้ว่าคุณจะใช้งานได้ฟรี แต่โปรดจำไว้ว่าการเผยแพร่โค้ดซ้ำจะต้องเป็นไปตาม กฎระเบียบการใช้งาน ของเรา
คำจำกัดสิทธิ์ความรับผิดชอบ
ข้อมูลและบทความไม่ได้มีวัตถุประสงค์เพื่อก่อให้เกิดกิจกรรมทางการเงิน, การลงทุน, การซื้อขาย, ข้อเสนอแนะ หรือคำแนะนำประเภทอื่น ๆ ที่ให้หรือรับรองโดย TradingView อ่านเพิ่มเติมใน ข้อกำหนดการใช้งาน