OPEN-SOURCE SCRIPT
ที่อัปเดต: pivot semaphore support&resistance levels [LM]
Hello Traders,
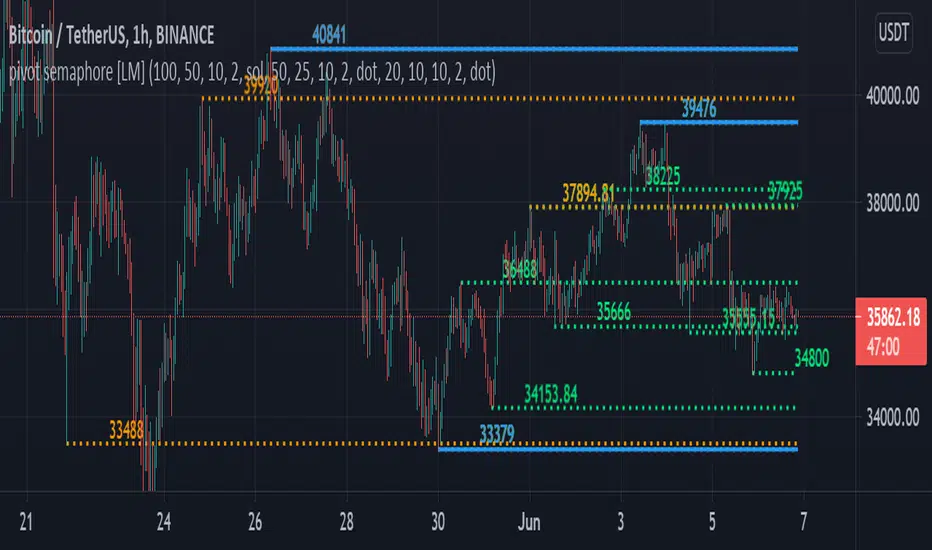
I would like to introduce you pivot semaphore support&resistance levels. The idea is the same as the zigzag script of mine to spot the importance of support&resistence
The Semafor is used to spot future multi-level Supports and Resistance zones.
It is also useful to spot HL or LL or HH or LH zones at different Depth settings.
The red zones are the extreme places where the market has a higher chance of reversing while the green zones have the lowest setting with lower chances of the market reversal
The lines can be extended like so

The lines also can just stop extending when price will reach it

Enjoy!
I would like to introduce you pivot semaphore support&resistance levels. The idea is the same as the zigzag script of mine to spot the importance of support&resistence
The Semafor is used to spot future multi-level Supports and Resistance zones.
It is also useful to spot HL or LL or HH or LH zones at different Depth settings.
The red zones are the extreme places where the market has a higher chance of reversing while the green zones have the lowest setting with lower chances of the market reversal
The lines can be extended like so
The lines also can just stop extending when price will reach it
Enjoy!
เอกสารเผยแพร่
Hey guys, I did some update in settings to make it more configurable, hope you enjoy itเอกสารเผยแพร่
conversion to pine version 5 and fixing error with max_bars_backสคริปต์โอเพนซอร์ซ
ด้วยเจตนารมณ์หลักของ TradingView ผู้สร้างสคริปต์นี้ได้ทำให้เป็นโอเพนซอร์ส เพื่อให้เทรดเดอร์สามารถตรวจสอบและยืนยันฟังก์ชันการทำงานของมันได้ ขอชื่นชมผู้เขียน! แม้ว่าคุณจะใช้งานได้ฟรี แต่โปรดจำไว้ว่าการเผยแพร่โค้ดซ้ำจะต้องเป็นไปตาม กฎระเบียบการใช้งาน ของเรา
คำจำกัดสิทธิ์ความรับผิดชอบ
ข้อมูลและบทความไม่ได้มีวัตถุประสงค์เพื่อก่อให้เกิดกิจกรรมทางการเงิน, การลงทุน, การซื้อขาย, ข้อเสนอแนะ หรือคำแนะนำประเภทอื่น ๆ ที่ให้หรือรับรองโดย TradingView อ่านเพิ่มเติมใน ข้อกำหนดการใช้งาน
สคริปต์โอเพนซอร์ซ
ด้วยเจตนารมณ์หลักของ TradingView ผู้สร้างสคริปต์นี้ได้ทำให้เป็นโอเพนซอร์ส เพื่อให้เทรดเดอร์สามารถตรวจสอบและยืนยันฟังก์ชันการทำงานของมันได้ ขอชื่นชมผู้เขียน! แม้ว่าคุณจะใช้งานได้ฟรี แต่โปรดจำไว้ว่าการเผยแพร่โค้ดซ้ำจะต้องเป็นไปตาม กฎระเบียบการใช้งาน ของเรา
คำจำกัดสิทธิ์ความรับผิดชอบ
ข้อมูลและบทความไม่ได้มีวัตถุประสงค์เพื่อก่อให้เกิดกิจกรรมทางการเงิน, การลงทุน, การซื้อขาย, ข้อเสนอแนะ หรือคำแนะนำประเภทอื่น ๆ ที่ให้หรือรับรองโดย TradingView อ่านเพิ่มเติมใน ข้อกำหนดการใช้งาน