OPEN-SOURCE SCRIPT
ที่อัปเดต: Sector Relative Strength

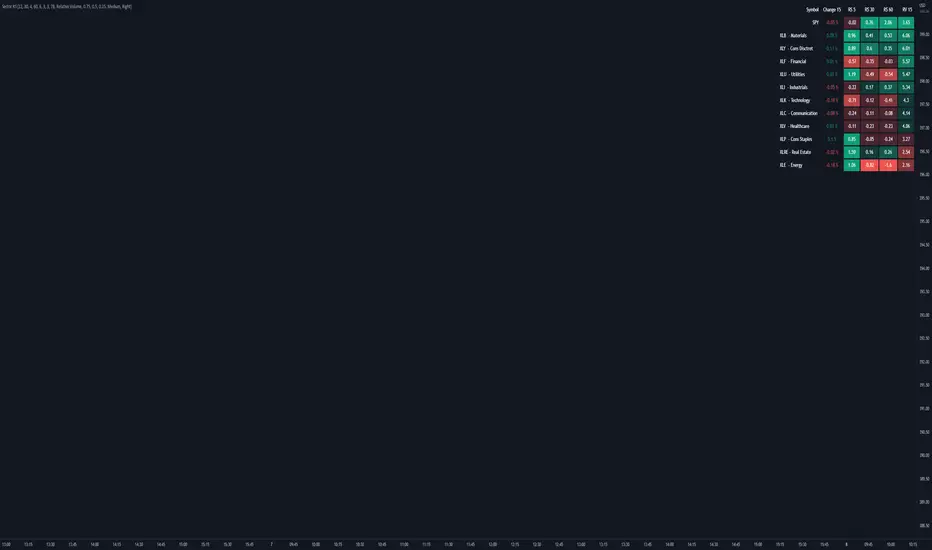
Custom version of my previous scanner built for S&P sectors
เอกสารเผยแพร่
The update introduce a completly revamped script, focused on the S&P sectors. This new version is less customizable but easier to use and more reliable : you can now load it on any timeframe and you're less likely to encounter an error message.However if you want to go back to the previous version, you can get the old code here : https://pastebin.com/2wRqTpP3
The script can still display up to 5 columns of your choice and rank the sector using any ot these columns :
- 1 Price change
- 1 Relative volume
- 3 different Relative Strength
Note:
- The first relative strength column, price change and relative volume are always using the 5 minute data and you can't change that. However you are free to change the period of the Relative strength and the number of candles used to calculate the price change and the relative volume.
- The second and third relative strength are completly customizable
- The formula used for the relative strength use the ATR but doesn't include volume
- The relative strength value for SPY correspond to the change divided by the ATR, this value is then used to calculate the Rs of each sector (sector_change - ((spy_change / spy_atr) * sector_atr)) / sector_atr
- Concerning the colors of the relative volume, SPY RV turns green when above 1, but the sector RV are turning green when above the SPY RV
เอกสารเผยแพร่
Added a minor changeสคริปต์โอเพนซอร์ซ
ด้วยเจตนารมณ์หลักของ TradingView ผู้สร้างสคริปต์นี้ได้ทำให้เป็นโอเพนซอร์ส เพื่อให้เทรดเดอร์สามารถตรวจสอบและยืนยันฟังก์ชันการทำงานของมันได้ ขอชื่นชมผู้เขียน! แม้ว่าคุณจะใช้งานได้ฟรี แต่โปรดจำไว้ว่าการเผยแพร่โค้ดซ้ำจะต้องเป็นไปตาม กฎระเบียบการใช้งาน ของเรา
คำจำกัดสิทธิ์ความรับผิดชอบ
ข้อมูลและบทความไม่ได้มีวัตถุประสงค์เพื่อก่อให้เกิดกิจกรรมทางการเงิน, การลงทุน, การซื้อขาย, ข้อเสนอแนะ หรือคำแนะนำประเภทอื่น ๆ ที่ให้หรือรับรองโดย TradingView อ่านเพิ่มเติมใน ข้อกำหนดการใช้งาน
สคริปต์โอเพนซอร์ซ
ด้วยเจตนารมณ์หลักของ TradingView ผู้สร้างสคริปต์นี้ได้ทำให้เป็นโอเพนซอร์ส เพื่อให้เทรดเดอร์สามารถตรวจสอบและยืนยันฟังก์ชันการทำงานของมันได้ ขอชื่นชมผู้เขียน! แม้ว่าคุณจะใช้งานได้ฟรี แต่โปรดจำไว้ว่าการเผยแพร่โค้ดซ้ำจะต้องเป็นไปตาม กฎระเบียบการใช้งาน ของเรา
คำจำกัดสิทธิ์ความรับผิดชอบ
ข้อมูลและบทความไม่ได้มีวัตถุประสงค์เพื่อก่อให้เกิดกิจกรรมทางการเงิน, การลงทุน, การซื้อขาย, ข้อเสนอแนะ หรือคำแนะนำประเภทอื่น ๆ ที่ให้หรือรับรองโดย TradingView อ่านเพิ่มเติมใน ข้อกำหนดการใช้งาน