PROTECTED SOURCE SCRIPT
Relative Strength Index + MTF VEIODORIO
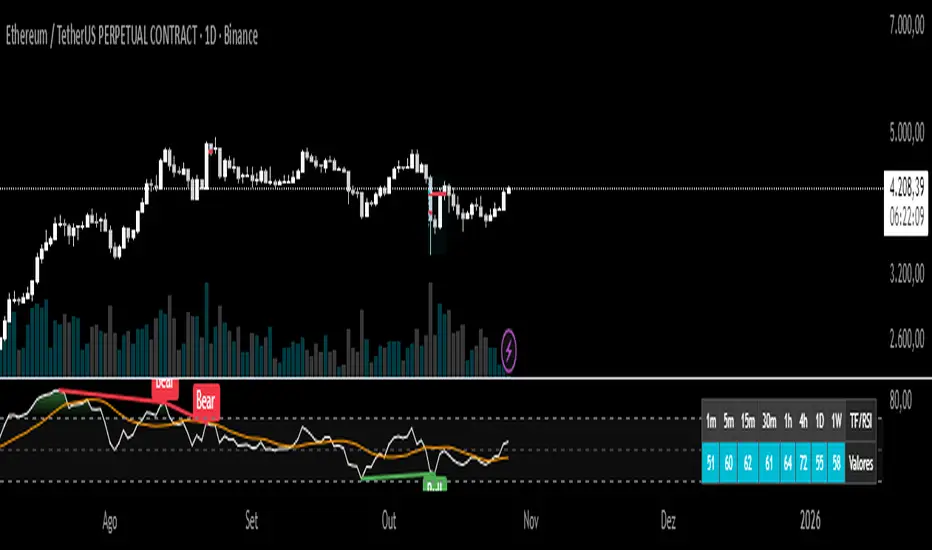
An advanced technical indicator that combines multiple RSI (Relative Strength Index) analysis features into a single, comprehensive tool.
Main Features:
1. Traditional RSI
Calculates the standard Relative Strength Index with a configurable period (default: 14)
Displays overbought and oversold levels
Includes colored background fill for better visualization
2. Multi-Timeframe (MTF) Chart
Displays RSI values simultaneously across 8 different timeframes:
1 minute, 5 minutes, 15 minutes, 30 minutes
1 hour, 4 hours, 1 day, 1 week
สคริปต์ที่ได้รับการป้องกัน
สคริปต์นี้ถูกเผยแพร่เป็นแบบ closed-source อย่างไรก็ตาม คุณสามารถใช้ได้อย่างอิสระและไม่มีข้อจำกัดใดๆ – เรียนรู้เพิ่มเติมได้ที่นี่
คำจำกัดสิทธิ์ความรับผิดชอบ
ข้อมูลและบทความไม่ได้มีวัตถุประสงค์เพื่อก่อให้เกิดกิจกรรมทางการเงิน, การลงทุน, การซื้อขาย, ข้อเสนอแนะ หรือคำแนะนำประเภทอื่น ๆ ที่ให้หรือรับรองโดย TradingView อ่านเพิ่มเติมใน ข้อกำหนดการใช้งาน