OPEN-SOURCE SCRIPT
ที่อัปเดต: TRI - Quick Analysis
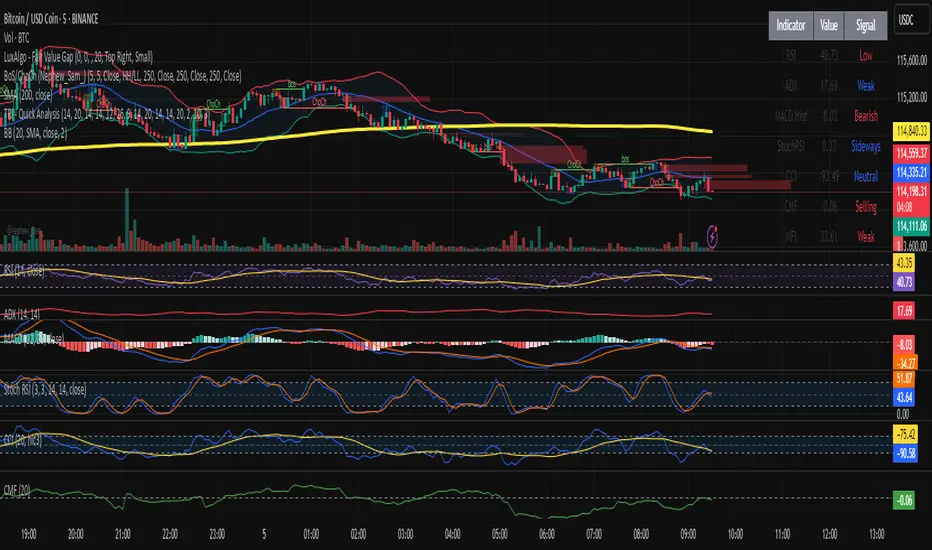
"TRI - Quick Analysis" is a multi-indicator dashboard designed to give traders an immediate overview of market momentum, trend strength, volume flow, and volatility.
It visually summarizes key technical indicators in a compact table, including:
Each value is color-coded (green, red, blue) based on whether it's favorable, unfavorable, or neutral for a potential long position.
At the bottom of the table, a summary score dynamically aggregates signals from all indicators and provides a simple trading score.
This tool is designed for discretionary traders looking for a quick, color-coded insight into current market conditions without relying on a single signal.
It visually summarizes key technical indicators in a compact table, including:
- RSI (momentum)
- MACD Histogram (trend momentum)
- ADX + SuperTrend (trend strength & direction)
- StochRSI (oversold/overbought)
- CCI (price deviation)
- CMF (volume flow)
- MFI (volume-weighted momentum)
- OBV (cumulative volume pressure)
- ATR (volatility)
- %B Bollinger (position within Bollinger Bands)
Each value is color-coded (green, red, blue) based on whether it's favorable, unfavorable, or neutral for a potential long position.
At the bottom of the table, a summary score dynamically aggregates signals from all indicators and provides a simple trading score.
This tool is designed for discretionary traders looking for a quick, color-coded insight into current market conditions without relying on a single signal.
เอกสารเผยแพร่
TRI - Quick Analysis is a multi-indicator dashboard designed to give traders an immediate overview of market momentum, trend strength, volume flow, and volatility.It visually summarizes key technical indicators in a compact table, including:
- RSI (momentum)
- MACD Histogram (trend momentum)
- ADX + SuperTrend (trend strength & direction)
- StochRSI (oversold/overbought)
- CCI (price deviation)
- CMF (volume flow)
- MFI (volume-weighted momentum)
- OBV (cumulative volume pressure)
- ATR (volatility)
- %B Bollinger (position within Bollinger Bands)
Each value is color-coded (green, red, blue) based on whether it's favorable, unfavorable, or neutral for a potential long position.
At the bottom of the table, a summary score dynamically aggregates signals from all indicators and provides a simple trading score.
This tool is designed for discretionary traders looking for a quick, color-coded insight into current market conditions without relying on a single signal.
สคริปต์โอเพนซอร์ซ
ด้วยเจตนารมณ์หลักของ TradingView ผู้สร้างสคริปต์นี้ได้ทำให้เป็นโอเพนซอร์ส เพื่อให้เทรดเดอร์สามารถตรวจสอบและยืนยันฟังก์ชันการทำงานของมันได้ ขอชื่นชมผู้เขียน! แม้ว่าคุณจะใช้งานได้ฟรี แต่โปรดจำไว้ว่าการเผยแพร่โค้ดซ้ำจะต้องเป็นไปตาม กฎระเบียบการใช้งาน ของเรา
คำจำกัดสิทธิ์ความรับผิดชอบ
ข้อมูลและบทความไม่ได้มีวัตถุประสงค์เพื่อก่อให้เกิดกิจกรรมทางการเงิน, การลงทุน, การซื้อขาย, ข้อเสนอแนะ หรือคำแนะนำประเภทอื่น ๆ ที่ให้หรือรับรองโดย TradingView อ่านเพิ่มเติมใน ข้อกำหนดการใช้งาน