OPEN-SOURCE SCRIPT
ที่อัปเดต: Supertrend with Stochastic OB/OS Arrows @KING
TradingView Idea: Supertrend with Stochastic Arrows KING
Overview:
- Combining the Supertrend indicator with Stochastic arrows for a comprehensive market
view, providing insights into trend direction and potential reversal points.
Supertrend Settings:
- ATR Length: The length parameter for calculating the Average True Range (ATR).
- Factor: A multiplier used to determine the distance of the Supertrend line from the
price.
Supertrend Display:
* The Supertrend is color-coded:
- During an uptrend, it is displayed in green.
- During a downtrend, it is displayed in red.
- The body of the candlesticks is filled with color during the corresponding trend direction.
Stochastic Settings:
- K Length: The period length for the %K line in the Stochastic oscillator.
- K Smoothing: Smoothing factor for %K.
- D Smoothing: Smoothing factor for %D.
- Overbought Level: The threshold indicating an overbought condition.
- Oversold Level: The threshold indicating an oversold condition.
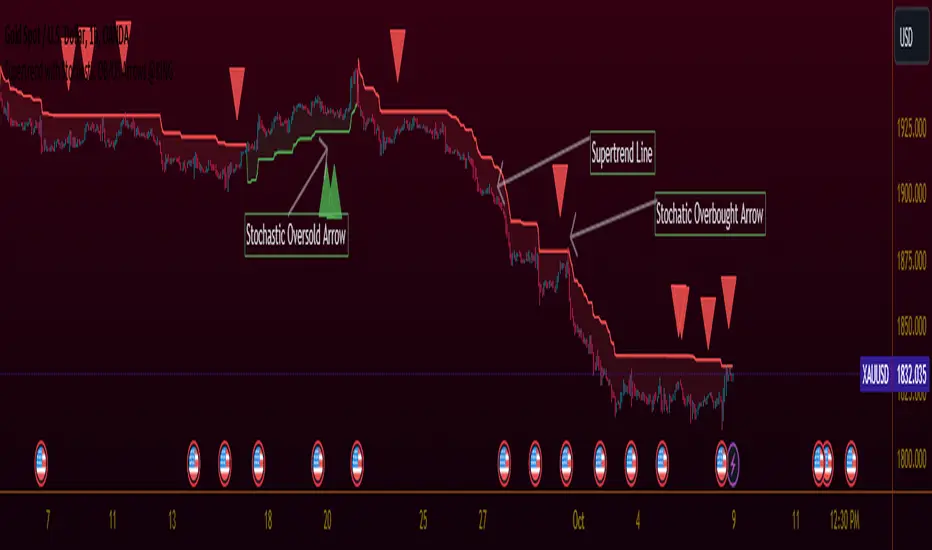
Arrows:
- Buy arrows are displayed below the bars during a downtrend when Stochastic is below the
oversold level.
- Sell arrows are displayed above the bars during an uptrend when Stochastic is above the
overbought level.
Supertrend Display:
- The Supertrend line is plotted with a color change based on its direction.
- The body of the candlesticks is filled with green during an uptrend and red during a downtrend.
Usage:
- Traders can use this script to identify potential entry and exit points, leveraging the
insights provided by both the Supertrend indicator and Stochastic oscillator. This
combination aims to capture trend strength and potential reversal opportunities.
เอกสารเผยแพร่
TradingView Idea: Supertrend with Stochastic Arrows KING
Overview:
- Combining the Supertrend indicator with Stochastic arrows for a comprehensive market view, providing insights into trend direction and potential reversal points.
Supertrend Settings:
- ATR Length: The length parameter for calculating the Average True Range (ATR).
- Factor: A multiplier used to determine the distance of the Supertrend line from the price.
Supertrend Display:
- The Supertrend is color-coded:
- During an uptrend, it is displayed in green.
- During a downtrend, it is displayed in red.
- The body of the candlesticks is filled with color during the corresponding trend direction.
Stochastic Settings:
- K Length: The period length for the %K line in the Stochastic oscillator.
- K Smoothing: Smoothing factor for %K.
- D Smoothing: Smoothing factor for %D.
- Overbought Level: The threshold indicating an overbought condition.
- Oversold Level: The threshold indicating an oversold condition.
Arrows:
- Buy arrows are displayed below the bars during a downtrend when Stochastic is below the oversold level.
- Sell arrows are displayed above the bars during an uptrend when Stochastic is above the overbought level.
Supertrend Display:
- The Supertrend line is plotted with a color change based on its direction.
- The body of the candlesticks is filled with green during an uptrend and red during a downtrend.
Usage:
- Traders can use this script to identify potential entry and exit points, leveraging the insights provided by both the Supertrend indicator and Stochastic oscillator. This combination aims to capture trend strength and potential reversal opportunities.
---
This format uses for bold and
สคริปต์โอเพนซอร์ซ
ด้วยเจตนารมณ์หลักของ TradingView ผู้สร้างสคริปต์นี้ได้ทำให้เป็นโอเพนซอร์ส เพื่อให้เทรดเดอร์สามารถตรวจสอบและยืนยันฟังก์ชันการทำงานของมันได้ ขอชื่นชมผู้เขียน! แม้ว่าคุณจะใช้งานได้ฟรี แต่โปรดจำไว้ว่าการเผยแพร่โค้ดซ้ำจะต้องเป็นไปตาม กฎระเบียบการใช้งาน ของเรา
คำจำกัดสิทธิ์ความรับผิดชอบ
ข้อมูลและบทความไม่ได้มีวัตถุประสงค์เพื่อก่อให้เกิดกิจกรรมทางการเงิน, การลงทุน, การซื้อขาย, ข้อเสนอแนะ หรือคำแนะนำประเภทอื่น ๆ ที่ให้หรือรับรองโดย TradingView อ่านเพิ่มเติมใน ข้อกำหนดการใช้งาน