PROTECTED SOURCE SCRIPT
ที่อัปเดต: 📊 Monitor F&M - RLYON
SCRIPT OBJECTIVE
It's a confluence system that combines four key indicators to identify high-probability trading setups. It basically tells you when and where to enter the market with greater confidence.
🔧 THE 4 BASE INDICATORS
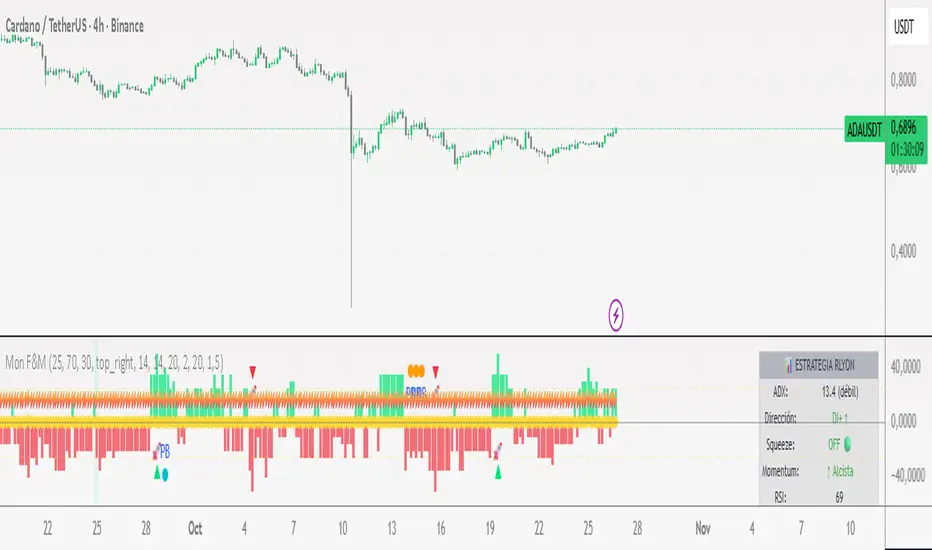
1. ADX (Average Directional Index)
What it measures: The strength of the trend (not the direction)
How to use it:
ADX ≥ 25 = STRONG trend ✅
ADX < 25 = Weak or sideways trend
What it does: Filters trades. You only look for entries when there is real strength in the market.
2. DI+ and DI- (Directional Indicators)
What it measures: The direction of the trend.
How to use it:
DI+ > DI- = Bullish trend 📈
DI- > DI+ = Bearish trend 📉
What it does: Defines whether you are looking for buys or sells.
3. TTM Squeeze (Bollinger Bands + Keltner Channels)
What it measures: Volatility compression and explosion.
States:
Squeeze ON 🔴: Volatility compressed (like a tightened spring).
Squeeze OFF 🟢: Volatility released (the spring is released = strong movement).
Transition 🔵: Changing state.
Momentum: The green/red histogram shows the direction of the movement.
Green rising = Strong bullish trend.
Red falling = Strong bearish trend.
4. RSI (Relative Strength Index)
What it measures: Whether the price is overbought or oversold.
Zones:
RSI > 70 = Overbought ⚠️ (be careful with purchases)
RSI < 30 = Oversold ✅ (bullish opportunity zone)
RSI 40-60 = Neutral zone/ideal for pullbacks
🎯 THE 2 MAIN STRATEGIES
STRATEGY 1: MOMENTUM (The strongest) 🚀
BUY setup:
✅ Squeeze released (changed from ON to OFF)
✅ Momentum green AND growing
✅ ADX ≥ 25 (strong trend)
✅ RSI not overbought (< 70)
SELL setup:
✅ Squeeze released (changed from ON to OFF)
✅ Momentum red AND Decreasing
✅ ADX ≥ 25 (strong trend)
✅ RSI not oversold (> 30)
When to trade: When you see the triangle 🚀 on the chart
STRATEGY 2: PULLBACK (Established trend) 📈📉
BUY setup:
✅ DI+ > DI- (established uptrend)
✅ ADX ≥ 25 (strong trend)
✅ RSI between 40-55 (healthy pullback)
✅ Momentum starting to turn upward
SELL setup:
✅ DI- > DI+ (established downtrend)
✅ ADX ≥ 25 (strong trend)
✅ RSI between 45-60 (healthy pullback)
✅ Momentum starting to turn downward
When to trade: When you see the "PB" circle in the graph
It's a confluence system that combines four key indicators to identify high-probability trading setups. It basically tells you when and where to enter the market with greater confidence.
🔧 THE 4 BASE INDICATORS
1. ADX (Average Directional Index)
What it measures: The strength of the trend (not the direction)
How to use it:
ADX ≥ 25 = STRONG trend ✅
ADX < 25 = Weak or sideways trend
What it does: Filters trades. You only look for entries when there is real strength in the market.
2. DI+ and DI- (Directional Indicators)
What it measures: The direction of the trend.
How to use it:
DI+ > DI- = Bullish trend 📈
DI- > DI+ = Bearish trend 📉
What it does: Defines whether you are looking for buys or sells.
3. TTM Squeeze (Bollinger Bands + Keltner Channels)
What it measures: Volatility compression and explosion.
States:
Squeeze ON 🔴: Volatility compressed (like a tightened spring).
Squeeze OFF 🟢: Volatility released (the spring is released = strong movement).
Transition 🔵: Changing state.
Momentum: The green/red histogram shows the direction of the movement.
Green rising = Strong bullish trend.
Red falling = Strong bearish trend.
4. RSI (Relative Strength Index)
What it measures: Whether the price is overbought or oversold.
Zones:
RSI > 70 = Overbought ⚠️ (be careful with purchases)
RSI < 30 = Oversold ✅ (bullish opportunity zone)
RSI 40-60 = Neutral zone/ideal for pullbacks
🎯 THE 2 MAIN STRATEGIES
STRATEGY 1: MOMENTUM (The strongest) 🚀
BUY setup:
✅ Squeeze released (changed from ON to OFF)
✅ Momentum green AND growing
✅ ADX ≥ 25 (strong trend)
✅ RSI not overbought (< 70)
SELL setup:
✅ Squeeze released (changed from ON to OFF)
✅ Momentum red AND Decreasing
✅ ADX ≥ 25 (strong trend)
✅ RSI not oversold (> 30)
When to trade: When you see the triangle 🚀 on the chart
STRATEGY 2: PULLBACK (Established trend) 📈📉
BUY setup:
✅ DI+ > DI- (established uptrend)
✅ ADX ≥ 25 (strong trend)
✅ RSI between 40-55 (healthy pullback)
✅ Momentum starting to turn upward
SELL setup:
✅ DI- > DI+ (established downtrend)
✅ ADX ≥ 25 (strong trend)
✅ RSI between 45-60 (healthy pullback)
✅ Momentum starting to turn downward
When to trade: When you see the "PB" circle in the graph
เอกสารเผยแพร่
mejorada la calidad del panel informativoสคริปต์ที่ได้รับการป้องกัน
สคริปต์นี้ถูกเผยแพร่เป็นแบบ closed-source อย่างไรก็ตาม คุณสามารถใช้ได้อย่างอิสระและไม่มีข้อจำกัดใดๆ – เรียนรู้เพิ่มเติมได้ที่นี่
คำจำกัดสิทธิ์ความรับผิดชอบ
ข้อมูลและบทความไม่ได้มีวัตถุประสงค์เพื่อก่อให้เกิดกิจกรรมทางการเงิน, การลงทุน, การซื้อขาย, ข้อเสนอแนะ หรือคำแนะนำประเภทอื่น ๆ ที่ให้หรือรับรองโดย TradingView อ่านเพิ่มเติมใน ข้อกำหนดการใช้งาน
สคริปต์ที่ได้รับการป้องกัน
สคริปต์นี้ถูกเผยแพร่เป็นแบบ closed-source อย่างไรก็ตาม คุณสามารถใช้ได้อย่างอิสระและไม่มีข้อจำกัดใดๆ – เรียนรู้เพิ่มเติมได้ที่นี่
คำจำกัดสิทธิ์ความรับผิดชอบ
ข้อมูลและบทความไม่ได้มีวัตถุประสงค์เพื่อก่อให้เกิดกิจกรรมทางการเงิน, การลงทุน, การซื้อขาย, ข้อเสนอแนะ หรือคำแนะนำประเภทอื่น ๆ ที่ให้หรือรับรองโดย TradingView อ่านเพิ่มเติมใน ข้อกำหนดการใช้งาน