OPEN-SOURCE SCRIPT
ที่อัปเดต: EGARCH Volatility Estimator
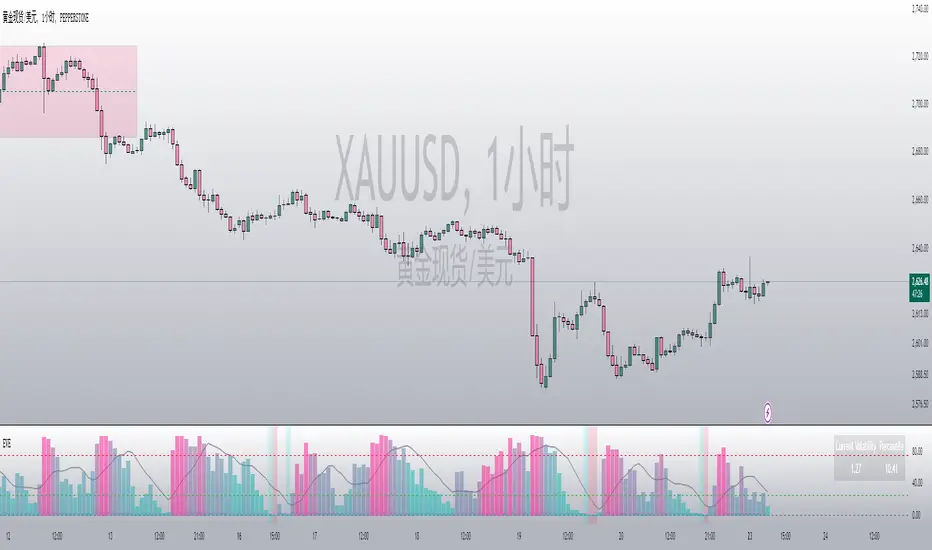
EGARCH Volatility Estimator (EVE)
Overview:
The EGARCH Volatility Estimator (EVE) is a Pine Script indicator designed to quantify market volatility using the Exponential Generalized Autoregressive Conditional Heteroskedasticity (EGARCH) model. This model captures both symmetric and asymmetric volatility dynamics and provides a robust tool for analyzing market risk and trends.
Key Features:
Core EGARCH Formula:
ln(σ t 2 )=ω+α(∣ϵ t−1 ∣+γ⋅ϵ t−1 )+β⋅ln(σ t−1 2 )
ω (Omega): Captures long-term baseline volatility.
α (Alpha): Measures sensitivity to recent shocks.
γ (Gamma): Incorporates asymmetric effects (e.g., higher volatility during market drops).
β (Beta): Reflects the persistence of historical volatility.
The formula computes log-volatility, which is then converted to actual volatility for interpretation.
Standardized Returns:
The script calculates daily log-returns and standardizes them to measure deviations from expected price changes.
Percentile-Based Volatility Analysis:
Tracks the percentile rank of current volatility over a historical lookback period.
Highlights high, medium, or low volatility zones using dynamic background colors.
Dynamic Normalization:
Maps volatility into a normalized range ([0,1]) for better visual interpretation.
Uses color gradients (green to red) to reflect changing volatility levels.
SMA Integration:
Adds a Simple Moving Average (SMA) of either EGARCH volatility or its percentile for trend analysis.
Interactive Display:
Displays current volatility and its percentile rank in a table for quick reference.
Includes high (75%) and low (25%) volatility threshold lines for actionable insights.
Applications:
Market Risk Assessment: Evaluate current and historical volatility to assess market risk levels.
Quantitative Strategy Development: Incorporate volatility dynamics into trading strategies, particularly for options or risk-managed portfolios.
Trend and Momentum Analysis: Use normalized or smoothed volatility trends to identify potential reversals or breakouts.
Asymmetric Volatility Detection: Highlight periods where downside or upside volatility dominates.
Visualization Enhancements:
Dynamic colors and thresholds make it intuitive to interpret market conditions.
Percentile views provide relative volatility context for historical comparison.
This indicator is a versatile tool for traders and analysts seeking deeper insights into market behavior, particularly in volatility-driven trading strategies.
เอกสารเผยแพร่
Fixed expression errors and chart display issues,By default, SMA is displayed in percentageสคริปต์โอเพนซอร์ซ
ด้วยเจตนารมณ์หลักของ TradingView ผู้สร้างสคริปต์นี้ได้ทำให้เป็นโอเพนซอร์ส เพื่อให้เทรดเดอร์สามารถตรวจสอบและยืนยันฟังก์ชันการทำงานของมันได้ ขอชื่นชมผู้เขียน! แม้ว่าคุณจะใช้งานได้ฟรี แต่โปรดจำไว้ว่าการเผยแพร่โค้ดซ้ำจะต้องเป็นไปตาม กฎระเบียบการใช้งาน ของเรา
คำจำกัดสิทธิ์ความรับผิดชอบ
ข้อมูลและบทความไม่ได้มีวัตถุประสงค์เพื่อก่อให้เกิดกิจกรรมทางการเงิน, การลงทุน, การซื้อขาย, ข้อเสนอแนะ หรือคำแนะนำประเภทอื่น ๆ ที่ให้หรือรับรองโดย TradingView อ่านเพิ่มเติมใน ข้อกำหนดการใช้งาน
สคริปต์โอเพนซอร์ซ
ด้วยเจตนารมณ์หลักของ TradingView ผู้สร้างสคริปต์นี้ได้ทำให้เป็นโอเพนซอร์ส เพื่อให้เทรดเดอร์สามารถตรวจสอบและยืนยันฟังก์ชันการทำงานของมันได้ ขอชื่นชมผู้เขียน! แม้ว่าคุณจะใช้งานได้ฟรี แต่โปรดจำไว้ว่าการเผยแพร่โค้ดซ้ำจะต้องเป็นไปตาม กฎระเบียบการใช้งาน ของเรา
คำจำกัดสิทธิ์ความรับผิดชอบ
ข้อมูลและบทความไม่ได้มีวัตถุประสงค์เพื่อก่อให้เกิดกิจกรรมทางการเงิน, การลงทุน, การซื้อขาย, ข้อเสนอแนะ หรือคำแนะนำประเภทอื่น ๆ ที่ให้หรือรับรองโดย TradingView อ่านเพิ่มเติมใน ข้อกำหนดการใช้งาน