OPEN-SOURCE SCRIPT
Comparaison DXY, VIX, SPX, DJI, GVZ
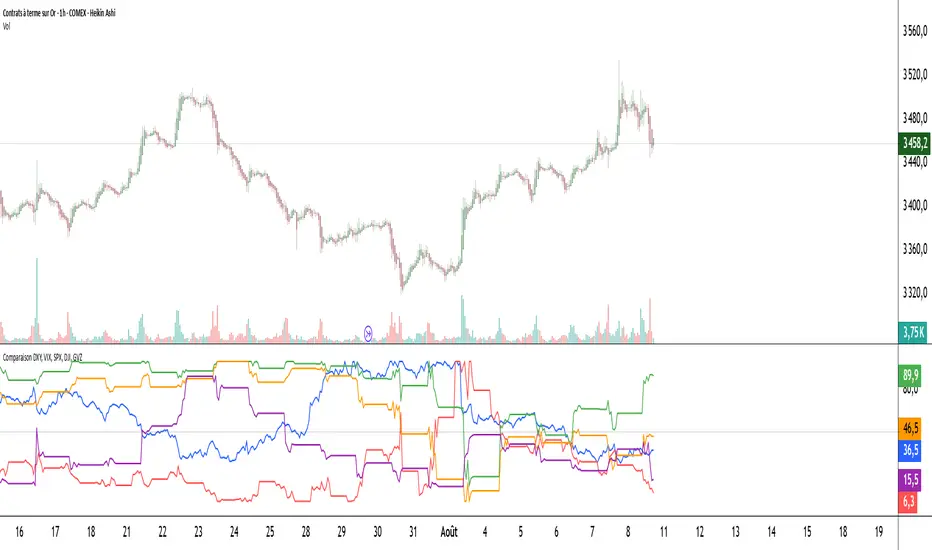
Pine Script indicator compares the normalized values of DXY, VIX, SPX, DJI, and GVZ indices on a single scale from 0 to 100. Here's a breakdown of what it does:
Data Requests: Gets closing prices for:
US Dollar Index (DXY)
VIX Volatility Index
S&P 500 (SPX)
Dow Jones Industrial Average (DJI)
Gold Volatility Index (GVZ)
Normalization: Each index is normalized using a 500-period lookback to scale values between 0-100, making them comparable despite different price scales.
Visualization:
Plots each normalized index with distinct colors
Adds a dotted midline at 50 for reference
Uses thicker linewidth (2) for better visibility
Timeframe Flexibility: Works on any chart timeframe since it uses timeframe.period
This is useful for:
Comparing relative strength/weakness between these key market indicators
Identifying divergences or convergences in their movements
Seeing how different asset classes (currencies, equities, volatility) relate
You could enhance this by:
Adding correlation calculations between pairs
Including options to adjust the normalization period
Adding alerts when instruments diverge beyond certain thresholds
Including volume or other metrics alongside price
สคริปต์โอเพนซอร์ซ
ด้วยเจตนารมณ์หลักของ TradingView ผู้สร้างสคริปต์นี้ได้ทำให้เป็นโอเพนซอร์ส เพื่อให้เทรดเดอร์สามารถตรวจสอบและยืนยันฟังก์ชันการทำงานของมันได้ ขอชื่นชมผู้เขียน! แม้ว่าคุณจะใช้งานได้ฟรี แต่โปรดจำไว้ว่าการเผยแพร่โค้ดซ้ำจะต้องเป็นไปตาม กฎระเบียบการใช้งาน ของเรา
คำจำกัดสิทธิ์ความรับผิดชอบ
ข้อมูลและบทความไม่ได้มีวัตถุประสงค์เพื่อก่อให้เกิดกิจกรรมทางการเงิน, การลงทุน, การซื้อขาย, ข้อเสนอแนะ หรือคำแนะนำประเภทอื่น ๆ ที่ให้หรือรับรองโดย TradingView อ่านเพิ่มเติมใน ข้อกำหนดการใช้งาน