OPEN-SOURCE SCRIPT
Ichimoku Bollinger Bands
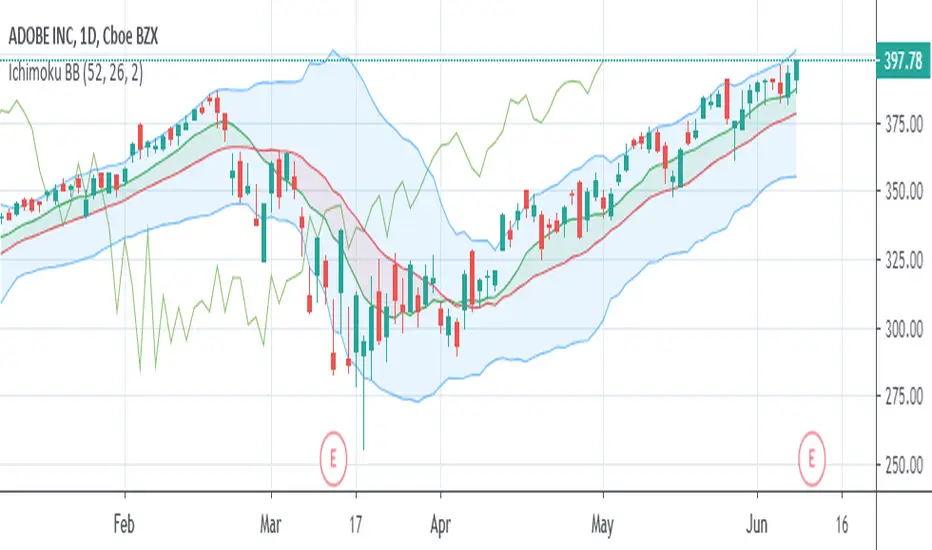
This indicator is a standard set of Bollinger Bands with some functionality borrowed from Ichimoku Kinko Hyo. There's an added SMA (9) that gets shaded green when it's above the basis line of the Bollinger Bands (SMA 20) and turns red when it falls below. No, it's not remotely where the Ichimoku Cloud would appear, but it's a decent trend indicator regardless.
You also get Ichimoku's Lagging Span to help verify the strength of the trend. When the Lagging Span rises above the price history, the trend is up. When the Lagging Span rises above the Bollinger Bands, the uptrend is super strong. And the opposite conditions signal downtrends.
You also get Ichimoku's Lagging Span to help verify the strength of the trend. When the Lagging Span rises above the price history, the trend is up. When the Lagging Span rises above the Bollinger Bands, the uptrend is super strong. And the opposite conditions signal downtrends.
สคริปต์โอเพนซอร์ซ
ด้วยเจตนารมณ์หลักของ TradingView ผู้สร้างสคริปต์นี้ได้ทำให้เป็นโอเพนซอร์ส เพื่อให้เทรดเดอร์สามารถตรวจสอบและยืนยันฟังก์ชันการทำงานของมันได้ ขอชื่นชมผู้เขียน! แม้ว่าคุณจะใช้งานได้ฟรี แต่โปรดจำไว้ว่าการเผยแพร่โค้ดซ้ำจะต้องเป็นไปตาม กฎระเบียบการใช้งาน ของเรา
คำจำกัดสิทธิ์ความรับผิดชอบ
ข้อมูลและบทความไม่ได้มีวัตถุประสงค์เพื่อก่อให้เกิดกิจกรรมทางการเงิน, การลงทุน, การซื้อขาย, ข้อเสนอแนะ หรือคำแนะนำประเภทอื่น ๆ ที่ให้หรือรับรองโดย TradingView อ่านเพิ่มเติมใน ข้อกำหนดการใช้งาน