PROTECTED SOURCE SCRIPT
ที่อัปเดต: Welivvinnlife & ocsabi03 OBV and GNL Hybrid Oscillator
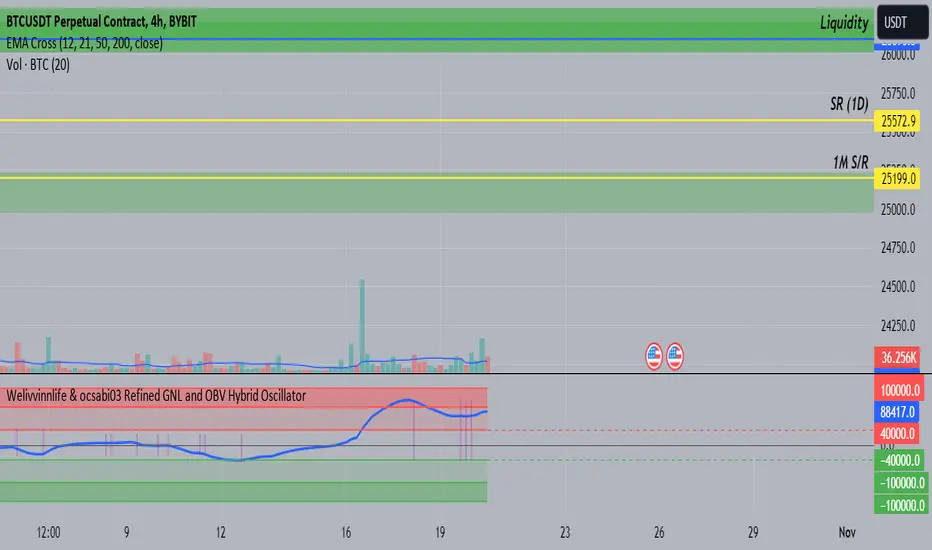
Signal Line (Blue): It gives a smoothed representation of the difference between OBV and GNL. When it moves upwards, it indicates that the recent differences between OBV and GNL are increasing, implying increased bullish momentum. When it moves downwards, it means that the differences are decreasing, suggesting increased bearish momentum.
The purple vertical lines are showing the inflection points of the blue line (if you want to see back in time use replay mode)
the green and red boxes ARE JUST VISUAL AIDS nothing else, not magic, those are the areas where a reversal can happen (not 100% of the time)
THIS IS NOT A MAGIC INDICATOR, ALWAYS USE THIS IN SOME KIND OF SYSTEM
เอกสารเผยแพร่
-สคริปต์ที่ได้รับการป้องกัน
สคริปต์นี้ถูกเผยแพร่เป็นแบบ closed-source อย่างไรก็ตาม คุณสามารถใช้ได้อย่างอิสระและไม่มีข้อจำกัดใดๆ – เรียนรู้เพิ่มเติมได้ที่นี่
คำจำกัดสิทธิ์ความรับผิดชอบ
ข้อมูลและบทความไม่ได้มีวัตถุประสงค์เพื่อก่อให้เกิดกิจกรรมทางการเงิน, การลงทุน, การซื้อขาย, ข้อเสนอแนะ หรือคำแนะนำประเภทอื่น ๆ ที่ให้หรือรับรองโดย TradingView อ่านเพิ่มเติมที่ ข้อกำหนดการใช้งาน
สคริปต์ที่ได้รับการป้องกัน
สคริปต์นี้ถูกเผยแพร่เป็นแบบ closed-source อย่างไรก็ตาม คุณสามารถใช้ได้อย่างอิสระและไม่มีข้อจำกัดใดๆ – เรียนรู้เพิ่มเติมได้ที่นี่
คำจำกัดสิทธิ์ความรับผิดชอบ
ข้อมูลและบทความไม่ได้มีวัตถุประสงค์เพื่อก่อให้เกิดกิจกรรมทางการเงิน, การลงทุน, การซื้อขาย, ข้อเสนอแนะ หรือคำแนะนำประเภทอื่น ๆ ที่ให้หรือรับรองโดย TradingView อ่านเพิ่มเติมที่ ข้อกำหนดการใช้งาน