OPEN-SOURCE SCRIPT
MT-RSI
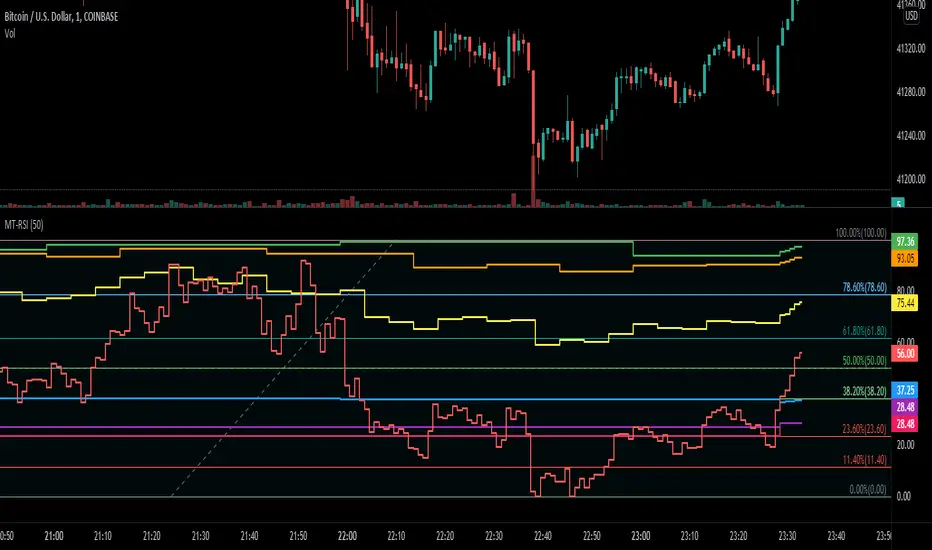
This script shows a "Multi Timeframe RSI" for a range. You could use this script to quickly detect if the RSI of the higher and lower timeframes are overbought or oversold.
RSI is relative to a lower timeframe. So 1H is relative to the 4H and the 4H relative to the 1D chart etc...
In this example you can see that the 1H timeframe (green line) is performing well but is in overbought territory, but the 4H timeframe (blue line) dit not perform that great relative to the 1H timeframe.
สคริปต์โอเพนซอร์ซ
ด้วยเจตนารมณ์หลักของ TradingView ผู้สร้างสคริปต์นี้ได้ทำให้เป็นโอเพนซอร์ส เพื่อให้เทรดเดอร์สามารถตรวจสอบและยืนยันฟังก์ชันการทำงานของมันได้ ขอชื่นชมผู้เขียน! แม้ว่าคุณจะใช้งานได้ฟรี แต่โปรดจำไว้ว่าการเผยแพร่โค้ดซ้ำจะต้องเป็นไปตาม กฎระเบียบการใช้งาน ของเรา
คำจำกัดสิทธิ์ความรับผิดชอบ
ข้อมูลและบทความไม่ได้มีวัตถุประสงค์เพื่อก่อให้เกิดกิจกรรมทางการเงิน, การลงทุน, การซื้อขาย, ข้อเสนอแนะ หรือคำแนะนำประเภทอื่น ๆ ที่ให้หรือรับรองโดย TradingView อ่านเพิ่มเติมใน ข้อกำหนดการใช้งาน