OPEN-SOURCE SCRIPT
ที่อัปเดต: WaveTrend [LazyBear] vX by DGT

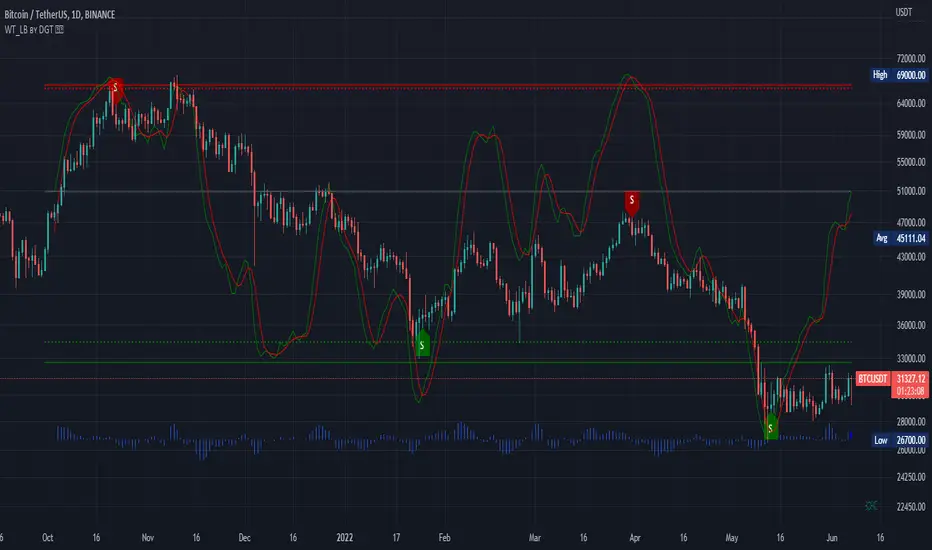
DGT interpreted version of LazyBear's WaveTrend, visualizing on Price Chart
Original Author : LazyBear
Crosses above or below threshold are emphasized with bigger labels
- crosses above threshold : probable short indications with a bigger label and relativly small label for probable long indications
- crosses below threshold : probable long indications with a bigger label and relativly small label for probable short indications
All rest crosses within threshold boundaries with relatively small labels for both long and short probable indications
เอกสารเผยแพร่
small update : alert condition addedเอกสารเผยแพร่
update thanks to sandyrindal suggestions, special thanks to himadded ability to change the signal length
added ability to compare with other symbols, can be symbols that are directly correlated or inversely correlated symbols
Here is the modified code for the ones who enjoy the WaveTrend Oscillator on separate pane
//@version=4
//@author LazyBear, modified by dgtrd
study(title="WaveTrend [LazyBear]", shorttitle="WT_LB vX ʙʏ DGT ☼☾")
n1 = input(10, "Length : Channel ", inline = "LEN")
n2 = input(21, "Average", inline = "LEN")
s1 = input(4 , "Signal Length")
obLevel1 = input( 60, "Over Bought Level 1", inline = "OB")
obLevel2 = input( 53, "Level 2" , inline = "OB")
osLevel1 = input(-60, "Over Sold Level 1" , inline = "OS")
osLevel2 = input(-53, "Level 2" , inline = "OS")
f_getWT(s) =>
ap = s
esa = ema(ap, n1)
d = ema(abs(ap - esa), n1)
ci = (ap - esa) / (0.015 * d)
tci = ema(ci, n2)
wt1 = tci
wt2 = sma(wt1, s1)
[wt1, wt2]
plot(0 , color=color.gray )
plot(obLevel1, color=color.red )
plot(osLevel1, color=color.green)
plot(obLevel2, color=color.red , style=3)
plot(osLevel2, color=color.green, style=3)
[wt1, wt2] = f_getWT(hlc3)
plot(wt1 , color=color.green)
plot(wt2 , color=color.red , style=3)
plot(wt1-wt2, color=color.blue , style=plot.style_area, transp=80)
compare = input(false, "Compare with Symbol", inline = "CPR")
symbol = input("CBOE:VIX" , "", type=input.symbol, inline = "CPR")
extSrc = security (symbol , timeframe.period, hlc3, barmerge.gaps_off, barmerge.lookahead_on)
[wt1x, wt2x] = f_getWT(extSrc)
plot(compare ? wt1x : na, color=color.aqua)
plot(compare ? wt2x : na, color=color.yellow, style=3)
plot(compare ? wt1x-wt2x : na, color=color.olive, style=plot.style_area, transp=80)
เอกสารเผยแพร่
added a label to display current values of the wavetrend and signal level เอกสารเผยแพร่
Update* overlay wavetrand display addition, better interpretation
* enhanced signal customizations
Similar Indicators
Oscillators Overlay w/ Divergencies/Alerts : Oscillators-Overlay-with-Divergencies-Alerts
Elliott Wave Oscillator Signals : EWO-Signals
สคริปต์โอเพนซอร์ซ
ด้วยเจตนารมณ์หลักของ TradingView ผู้สร้างสคริปต์นี้ได้ทำให้เป็นโอเพนซอร์ส เพื่อให้เทรดเดอร์สามารถตรวจสอบและยืนยันฟังก์ชันการทำงานของมันได้ ขอชื่นชมผู้เขียน! แม้ว่าคุณจะใช้งานได้ฟรี แต่โปรดจำไว้ว่าการเผยแพร่โค้ดซ้ำจะต้องเป็นไปตาม กฎระเบียบการใช้งาน ของเรา
Premium Indicators – Try Free for 15 Days: sites.google.com/view/solemare-analytics
คำจำกัดสิทธิ์ความรับผิดชอบ
ข้อมูลและบทความไม่ได้มีวัตถุประสงค์เพื่อก่อให้เกิดกิจกรรมทางการเงิน, การลงทุน, การซื้อขาย, ข้อเสนอแนะ หรือคำแนะนำประเภทอื่น ๆ ที่ให้หรือรับรองโดย TradingView อ่านเพิ่มเติมใน ข้อกำหนดการใช้งาน