OPEN-SOURCE SCRIPT
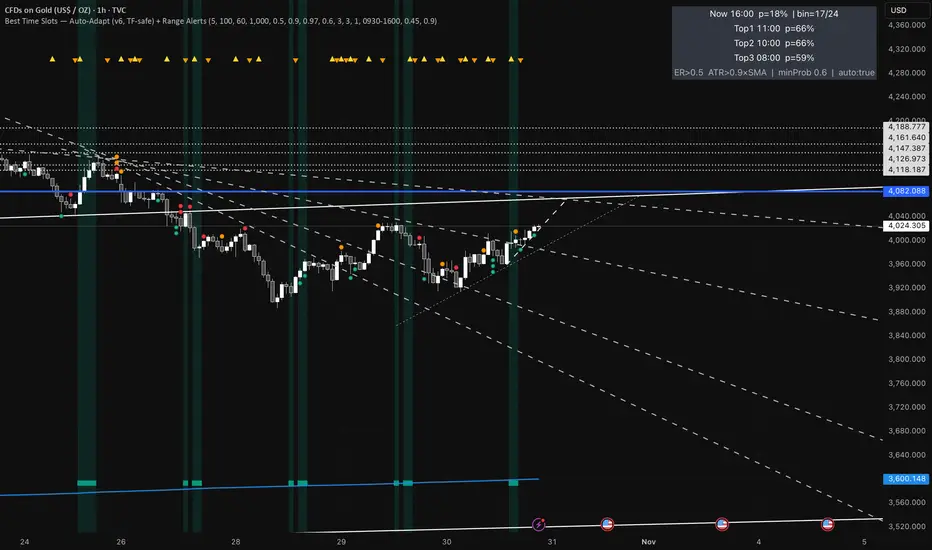
Best Time Slots — Auto-Adapt (v6, TF-safe) + Range Alerts
Time & binning
Auto-adapt to timeframe
Makes all time windows scale to your chart’s bar size (so it “just works” on 1m, 15m, 4H, Daily).
• On = recommended. • Off = fixed default lengths.
Minimum Bin (minutes)
The size of each daily time slot we track (e.g., 5-min bins). The script uses the larger of this and your bar size.
• Higher = fewer, broader slots; smoother stats. • Lower = more, narrower slots; needs more history.
• Try: 5–15 on intraday, 60–240 on higher TFs.
Lookback windows (used when Auto-adapt = ON)
Target ER Window (minutes)
How far back we look to judge Efficiency Ratio (how “straight” the move was).
• Higher = stricter/smoother; fewer bars qualify as “movement”. • Lower = more sensitive.
• Try: 60–120 min intraday; 240–600 min for higher TFs.
Target ATR Window (minutes)
How far back we compute ATR (typical range).
• Higher = steadier ATR baseline. • Lower = reacts faster.
• Try: 30–120 min intraday; 240–600 min higher TFs.
Target Normalization Window (minutes)
How far back for the average ATR (the baseline we compare to).
• Higher = stricter “above average range” check. • Lower = easier to pass.
• Try: ~500–1500 min.
What counts as “movement”
ER Threshold (0–1)
Minimum efficiency a bar must have to count as movement.
• Higher = only very “clean, one-direction” bars count. • Lower = more bars count.
• Try: 0.55–0.65. (0.60 = balanced.)
ATR Floor vs SMA(ATR)
Requires range to be at least this many × average ATR.
• Higher (e.g., 1.2) = demand bigger-than-usual ranges. • Lower (e.g., 0.9) = allow smaller ranges.
• Try: 1.0 (above average).
How history is averaged
Recent Days Weight (per-day decay)
Gives more weight to recent days. Example: 0.97 ≈ each day old counts ~3% less.
• Higher (0.99) = slower fade (older days matter more). • Lower (0.95) = faster fade.
• Try: 0.97–0.99.
Laplace Prior Seen / Laplace Prior Hit
“Starter counts” so early stats aren’t crazy when you have little data.
• Higher priors = probabilities start closer to average; need more real data to move.
• Try: Seen=3, Hit=1 (defaults).
Min Samples (effective)
Don’t highlight a slot unless it has at least this many effective samples (after decay + priors).
• Higher = safer, but fewer highlights early.
• Try: 3–10.
When to highlight on the chart
Min Probability to Highlight
We shade/mark bars only if their slot’s historical movement probability is ≥ this.
• Higher = pickier, fewer highlights. • Lower = more highlights.
• Try: 0.45–0.60.
Show Markers on Good Bins
Draws a small square on bars that fall in a “good” slot (in addition to the soft background).
Limit to market hours (optional)
Restrict to Session + Session
Only learn/score inside this time window (e.g., “0930-1600”). Uses the chart/exchange timezone.
• Turn on if you only care about RTH.
Range (chop) alerts
Range START if ER ≤
Triggers range when efficiency drops below this level (price starts zig-zagging).
• Higher = easier to call “range”. • Lower = stricter.
Range START if ATR ≤ this × SMA(ATR)
Also triggers range when ATR shrinks below this fraction of its average (volatility contraction).
• Higher (e.g., 1.0) = stricter (must be at/under average). • Lower (e.g., 0.9) = easier to call range.
Alerts on bar close
If ON, alerts fire once per bar close (cleaner). If OFF, they can trigger intrabar (faster, noisier).
Quick “what happens if I change X?”
Want more highlighted times? ↓ Min Probability, ↓ ER Threshold, or ↓ ATR Floor (e.g., 0.9).
Want stricter highlights? ↑ Min Probability, ↑ ER Threshold, or ↑ ATR Floor (e.g., 1.2).
Want recent days to matter more? ↑ Recent Days Weight toward 0.99.
On 4H/Daily, widen Minimum Bin (e.g., 60–240) and maybe lower Min Probability a bit.
สคริปต์โอเพนซอร์ซ
ด้วยเจตนารมณ์หลักของ TradingView ผู้สร้างสคริปต์นี้ได้ทำให้เป็นโอเพนซอร์ส เพื่อให้เทรดเดอร์สามารถตรวจสอบและยืนยันฟังก์ชันการทำงานของมันได้ ขอชื่นชมผู้เขียน! แม้ว่าคุณจะใช้งานได้ฟรี แต่โปรดจำไว้ว่าการเผยแพร่โค้ดซ้ำจะต้องเป็นไปตาม กฎระเบียบการใช้งาน ของเรา
คำจำกัดสิทธิ์ความรับผิดชอบ
ข้อมูลและบทความไม่ได้มีวัตถุประสงค์เพื่อก่อให้เกิดกิจกรรมทางการเงิน, การลงทุน, การซื้อขาย, ข้อเสนอแนะ หรือคำแนะนำประเภทอื่น ๆ ที่ให้หรือรับรองโดย TradingView อ่านเพิ่มเติมใน ข้อกำหนดการใช้งาน