OPEN-SOURCE SCRIPT
ATR Clouds
*Updated with Version 5*
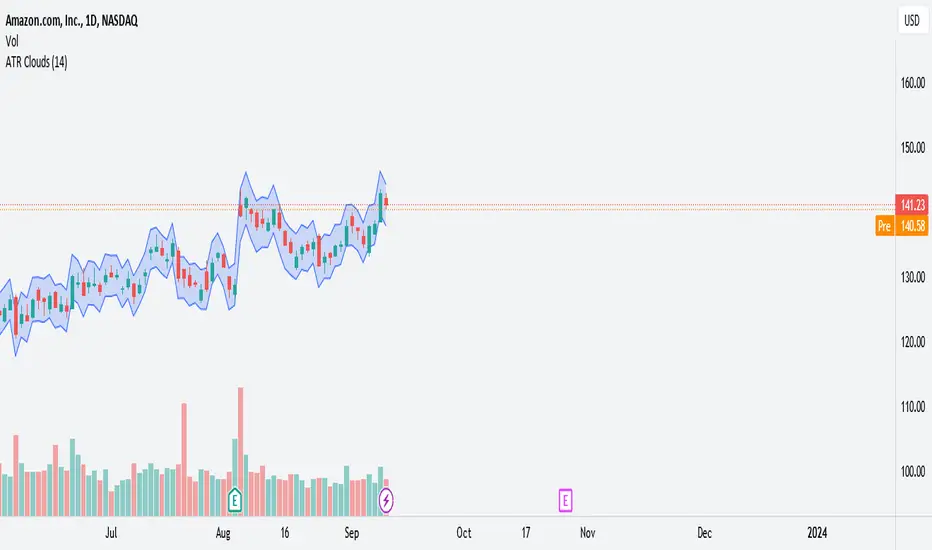
ATR Clouds
The "ATR Clouds" indicator provides a visual representation of the stock's volatility based on the Average True Range (ATR) calculation. It operates by plotting two bands around the closing price of a stock, using the ATR as a measure of volatility.
Features:
ATR Calculation: The Average True Range is a commonly used metric to understand the volatility of an asset. The indicator calculates the ATR over a user-defined period, with the default being 14 periods.
ATR Bands: Using the ATR value, the script defines two bands:
Upper Band: This is calculated by adding the ATR value to the closing price of the stock. It represents a higher volatility boundary.
Lower Band: This is derived by subtracting the ATR value from the closing price. It indicates a lower volatility boundary.
Cloud Visualization: The space between the upper and lower bands is shaded to create a "cloud" on the chart. This cloud gives traders a clear visual cue of the stock's current volatility range. The cloud has an 80% transparency, allowing the underlying price chart to remain visible.
Customization: Users have the ability to adjust the period for the ATR calculation based on their preferences.
Usage:
Traders can use the ATR Clouds indicator to get a sense of the stock's volatility. Wider clouds indicate periods of higher volatility, while narrower clouds suggest lower volatility. This can be beneficial for se
สคริปต์โอเพนซอร์ซ
ด้วยเจตนารมณ์หลักของ TradingView ผู้สร้างสคริปต์นี้ได้ทำให้เป็นโอเพนซอร์ส เพื่อให้เทรดเดอร์สามารถตรวจสอบและยืนยันฟังก์ชันการทำงานของมันได้ ขอชื่นชมผู้เขียน! แม้ว่าคุณจะใช้งานได้ฟรี แต่โปรดจำไว้ว่าการเผยแพร่โค้ดซ้ำจะต้องเป็นไปตาม กฎระเบียบการใช้งาน ของเรา
คำจำกัดสิทธิ์ความรับผิดชอบ
ข้อมูลและบทความไม่ได้มีวัตถุประสงค์เพื่อก่อให้เกิดกิจกรรมทางการเงิน, การลงทุน, การซื้อขาย, ข้อเสนอแนะ หรือคำแนะนำประเภทอื่น ๆ ที่ให้หรือรับรองโดย TradingView อ่านเพิ่มเติมใน ข้อกำหนดการใช้งาน