Candle Riders CR1
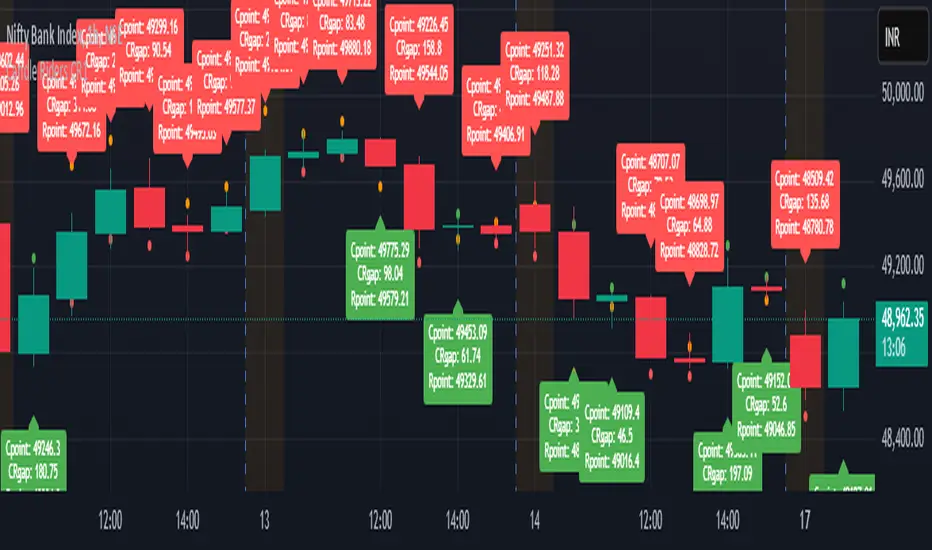
The **Candle Riders CR1** is an advanced trading tool designed to help traders anticipate potential market movements. It calculates three key levels – **Cpoint**, **Rpoint**, and **CRgap** – based on the high, low, and close values of the last 3 candles. These levels offer insights into possible price trends, reversals, and risk-to-reward scenarios, helping traders make more informed decisions.
This indicator is unique because it projects levels for the **next candle**, allowing traders to prepare for potential price movements rather than reacting to completed candles.
Key Features
1. **Cpoint**
- Indicates a potential price level for the next candle.
- If a **green signal** appears on the current candle, the upcoming candle might show an upward movement, with a tendency to reach the Cpoint.
- If a **red signal** appears, the next candle could show a downward movement towards the Cpoint.
2. **Rpoint**
- Represents a level where a trend reversal could occur.
- When the price reaches the Rpoint, it signals a potential change in direction.
- In case of a green signal, this could indicate a shift from an upward to a downward movement. Conversely, a red signal at the Rpoint might suggest a shift from downward to upward.
3. **CRgap**
- Reflects the distance between the last candle's closing price and the calculated Cpoint/Rpoint.
- It helps traders evaluate the risk-to-reward ratio for their potential trades.
- In case of a green signal, CRgap indicates the potential distance the price could move towards the Cpoint. If the price approaches the Rpoint, the same CRgap can guide target and stop levels.
- For a red signal, CRgap similarly represents the possible movement towards the Cpoint or a reversal at the Rpoint.
How It Works
The **Candle Riders CR1** uses a mathematical formula to calculate levels from the last 3 candles’ high, low, and close values. These levels provide a forward-looking view, projecting possible price movements for the **next candle**:
- **Green Signal on Current Candle**: Suggests a positive trend in the upcoming candle, with the price likely to move towards the Cpoint. The CRgap indicates the expected price movement, helping to set a risk-to-reward framework. If the price reaches the Rpoint, a reversal may occur, suggesting a change in direction.
- **Red Signal on Current Candle**: Implies a negative trend for the next candle, with the price tending to move towards the Cpoint. Here too, the CRgap helps assess risk and reward. If the price touches the Rpoint, a reversal might take place, indicating a potential upward movement.
- **Position Management**: If neither Cpoint nor Rpoint is reached, it is advisable to conclude the position when the current candle closes. However, if the same signal continues, the position can be carried forward to the next candle, although the levels for Cpoint, Rpoint, and CRgap will change.
Special Aspects
- **Predictive Analysis**: Unlike conventional indicators, CR1 calculates potential levels for the **next candle**, enabling traders to anticipate market movements.
- **Dynamic Updates**: Levels are recalculated with each new candle, ensuring relevance to evolving market conditions.
- **Multi-Time Frame Compatibility**: Suitable for all time frames, catering to intraday, swing, and positional traders.
Recommended Time Frames
Based on our **observations and back-testing**, the **Candle Riders CR1** has shown **consistent and reliable performance on the 15-minute, 30-minute, and 1-hour time frames**. These intervals appear to provide a balanced view of market movements, capturing trends effectively while minimizing noise.
While the indicator is versatile and can be used across various time frames, these specific durations have demonstrated a **higher degree of accuracy** and **clearer signal interpretation**.
It is important to note that past performance is not a guarantee of future results. Traders are encouraged to explore and adapt the time frames according to their trading style and risk appetite.
How to Use on
1. **Trend Anticipation**: Observe the signal on the current candle:
- **Green Signal**: Anticipate an upward movement in the next candle towards the Cpoint. Use CRgap to evaluate the potential movement. If the price approaches the Rpoint, it signals a potential reversal.
- **Red Signal**: Expect a downward movement in the next candle towards the Cpoint, using CRgap for risk-to-reward assessment. A reversal may occur if the price reaches the Rpoint.
2. **Reversal Indication**: The Rpoint serves as a crucial level for identifying potential trend reversals.
3. **Risk Management**: Utilize CRgap to set target and risk levels, aligning trades with calculated risk-to-reward ratios.
4. **Position Closure and Carry Forward**:
- If no significant movement occurs, consider closing the position at the candle’s end.
- If the same signal persists, the position can be carried forward to the next candle, keeping in mind that levels will be recalculated.
Important Notes
- The levels (Cpoint, Rpoint, CRgap) are calculated for the **next candle**, not the current one.
- Once the current candle closes, new levels are calculated, ensuring that the indicator remains forward-looking.
- These levels are meant to provide context and should be used as a guiding tool along with other trading strategies.
Disclaimer
The **Candle Riders CR1** indicator uses mathematical calculations to project potential price levels. These projections are for **informational and educational purposes only** and are not recommendations or guarantees of future price movements.
- Cpoint and Rpoint levels are based on historical market data and indicate potential price movement or reversal areas.
- CRgap helps traders evaluate risk-to-reward scenarios but should not be the sole basis for trading decisions.
- All trading decisions should be made with independent analysis and proper risk management.
Why It’s Special
1. **Forward-Looking Projections**: It predicts potential levels for the next candle, offering an anticipatory trading advantage.
2. **Dynamic Adaptation**: The indicator adapts to changing market conditions, recalculating levels with each new candle.
3. **Comprehensive Risk Analysis**: By calculating CRgap, it provides a clear framework for evaluating risk-to-reward ratios.
4. **Versatile Application**: Compatible with all time frames and markets, making it adaptable for different trading strategies.
5. **Suggested Time Frames**: Based on our experience, the **15-minute, 30-minute, and 1-hour** time frames have shown consistent and reliable performance.
สคริปต์แบบเฉพาะผู้ได้รับเชิญเท่านั้น
เฉพาะผู้ใช้งานที่ผู้เขียนอนุมัตเท่านั้นจึงจะสามารถเข้าถึงสคริปต์นี้ได้ คุณจะต้องขอและได้รับอนุญาตก่อนใช้งาน ซึ่งโดยทั่วไปจะได้รับอนุญาตหลังจากชำระเงินแล้ว สำหรับรายละเอียดเพิ่มเติม โปรดทำตามคำแนะนำของผู้เขียนด้านล่าง หรือติดต่อ vkumar8 โดยตรง
TradingView ไม่แนะนำให้จ่ายเงินหรือใช้สคริปต์ เว้นแต่คุณจะเชื่อถือผู้เขียนและเข้าใจวิธีการทำงานของสคริปต์นั้นอย่างถ่องแท้ คุณยังสามารถหาทางเลือกแบบโอเพนซอร์สฟรีได้ใน สคริปต์ชุมชนของเรา
คำแนะนำของผู้เขียน
คำจำกัดสิทธิ์ความรับผิดชอบ
สคริปต์แบบเฉพาะผู้ได้รับเชิญเท่านั้น
เฉพาะผู้ใช้งานที่ผู้เขียนอนุมัตเท่านั้นจึงจะสามารถเข้าถึงสคริปต์นี้ได้ คุณจะต้องขอและได้รับอนุญาตก่อนใช้งาน ซึ่งโดยทั่วไปจะได้รับอนุญาตหลังจากชำระเงินแล้ว สำหรับรายละเอียดเพิ่มเติม โปรดทำตามคำแนะนำของผู้เขียนด้านล่าง หรือติดต่อ vkumar8 โดยตรง
TradingView ไม่แนะนำให้จ่ายเงินหรือใช้สคริปต์ เว้นแต่คุณจะเชื่อถือผู้เขียนและเข้าใจวิธีการทำงานของสคริปต์นั้นอย่างถ่องแท้ คุณยังสามารถหาทางเลือกแบบโอเพนซอร์สฟรีได้ใน สคริปต์ชุมชนของเรา